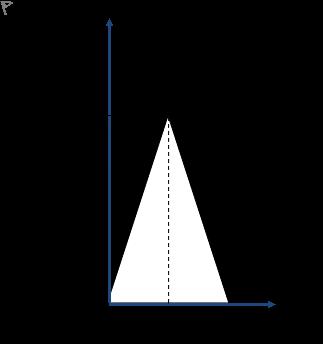
The graph shows the speed of a remote controlled toy speed boat on a river. It speeds up for six seconds and then slows down for the same amount of time. The boat's displacement (in metres) can be calculated from the area under this graph. What is it?数值题
登录即可查看完整答案
我们收录了全球超50000道真实原题与详细解析,现在登录,立即获得答案。
类似问题
What is the unit used to measure the quantity represented by the area under this graph?
An object's motion is illustrated using the graph below. (NOT DRAWN TO SCALE)Determine the total displacement of the object given the following values:A : 18.9 ms-1B : -10 ms-1C : 9.4 sD : 16.3 s
What is the physical quantity represented by the area under this graph? Choose the most appropriate answer. Take note of the quantities represented by the axes.
The speed-time graphs for three vehicles X, Y, and Z are shown. If x, y, and z are the distance travelled by X, Y, and Z respectively in 8 s, which of the following comparison is correct?
更多留学生实用工具
希望你的学习变得更简单
加入我们,立即解锁 海量真题 与 独家解析,让复习快人一步!