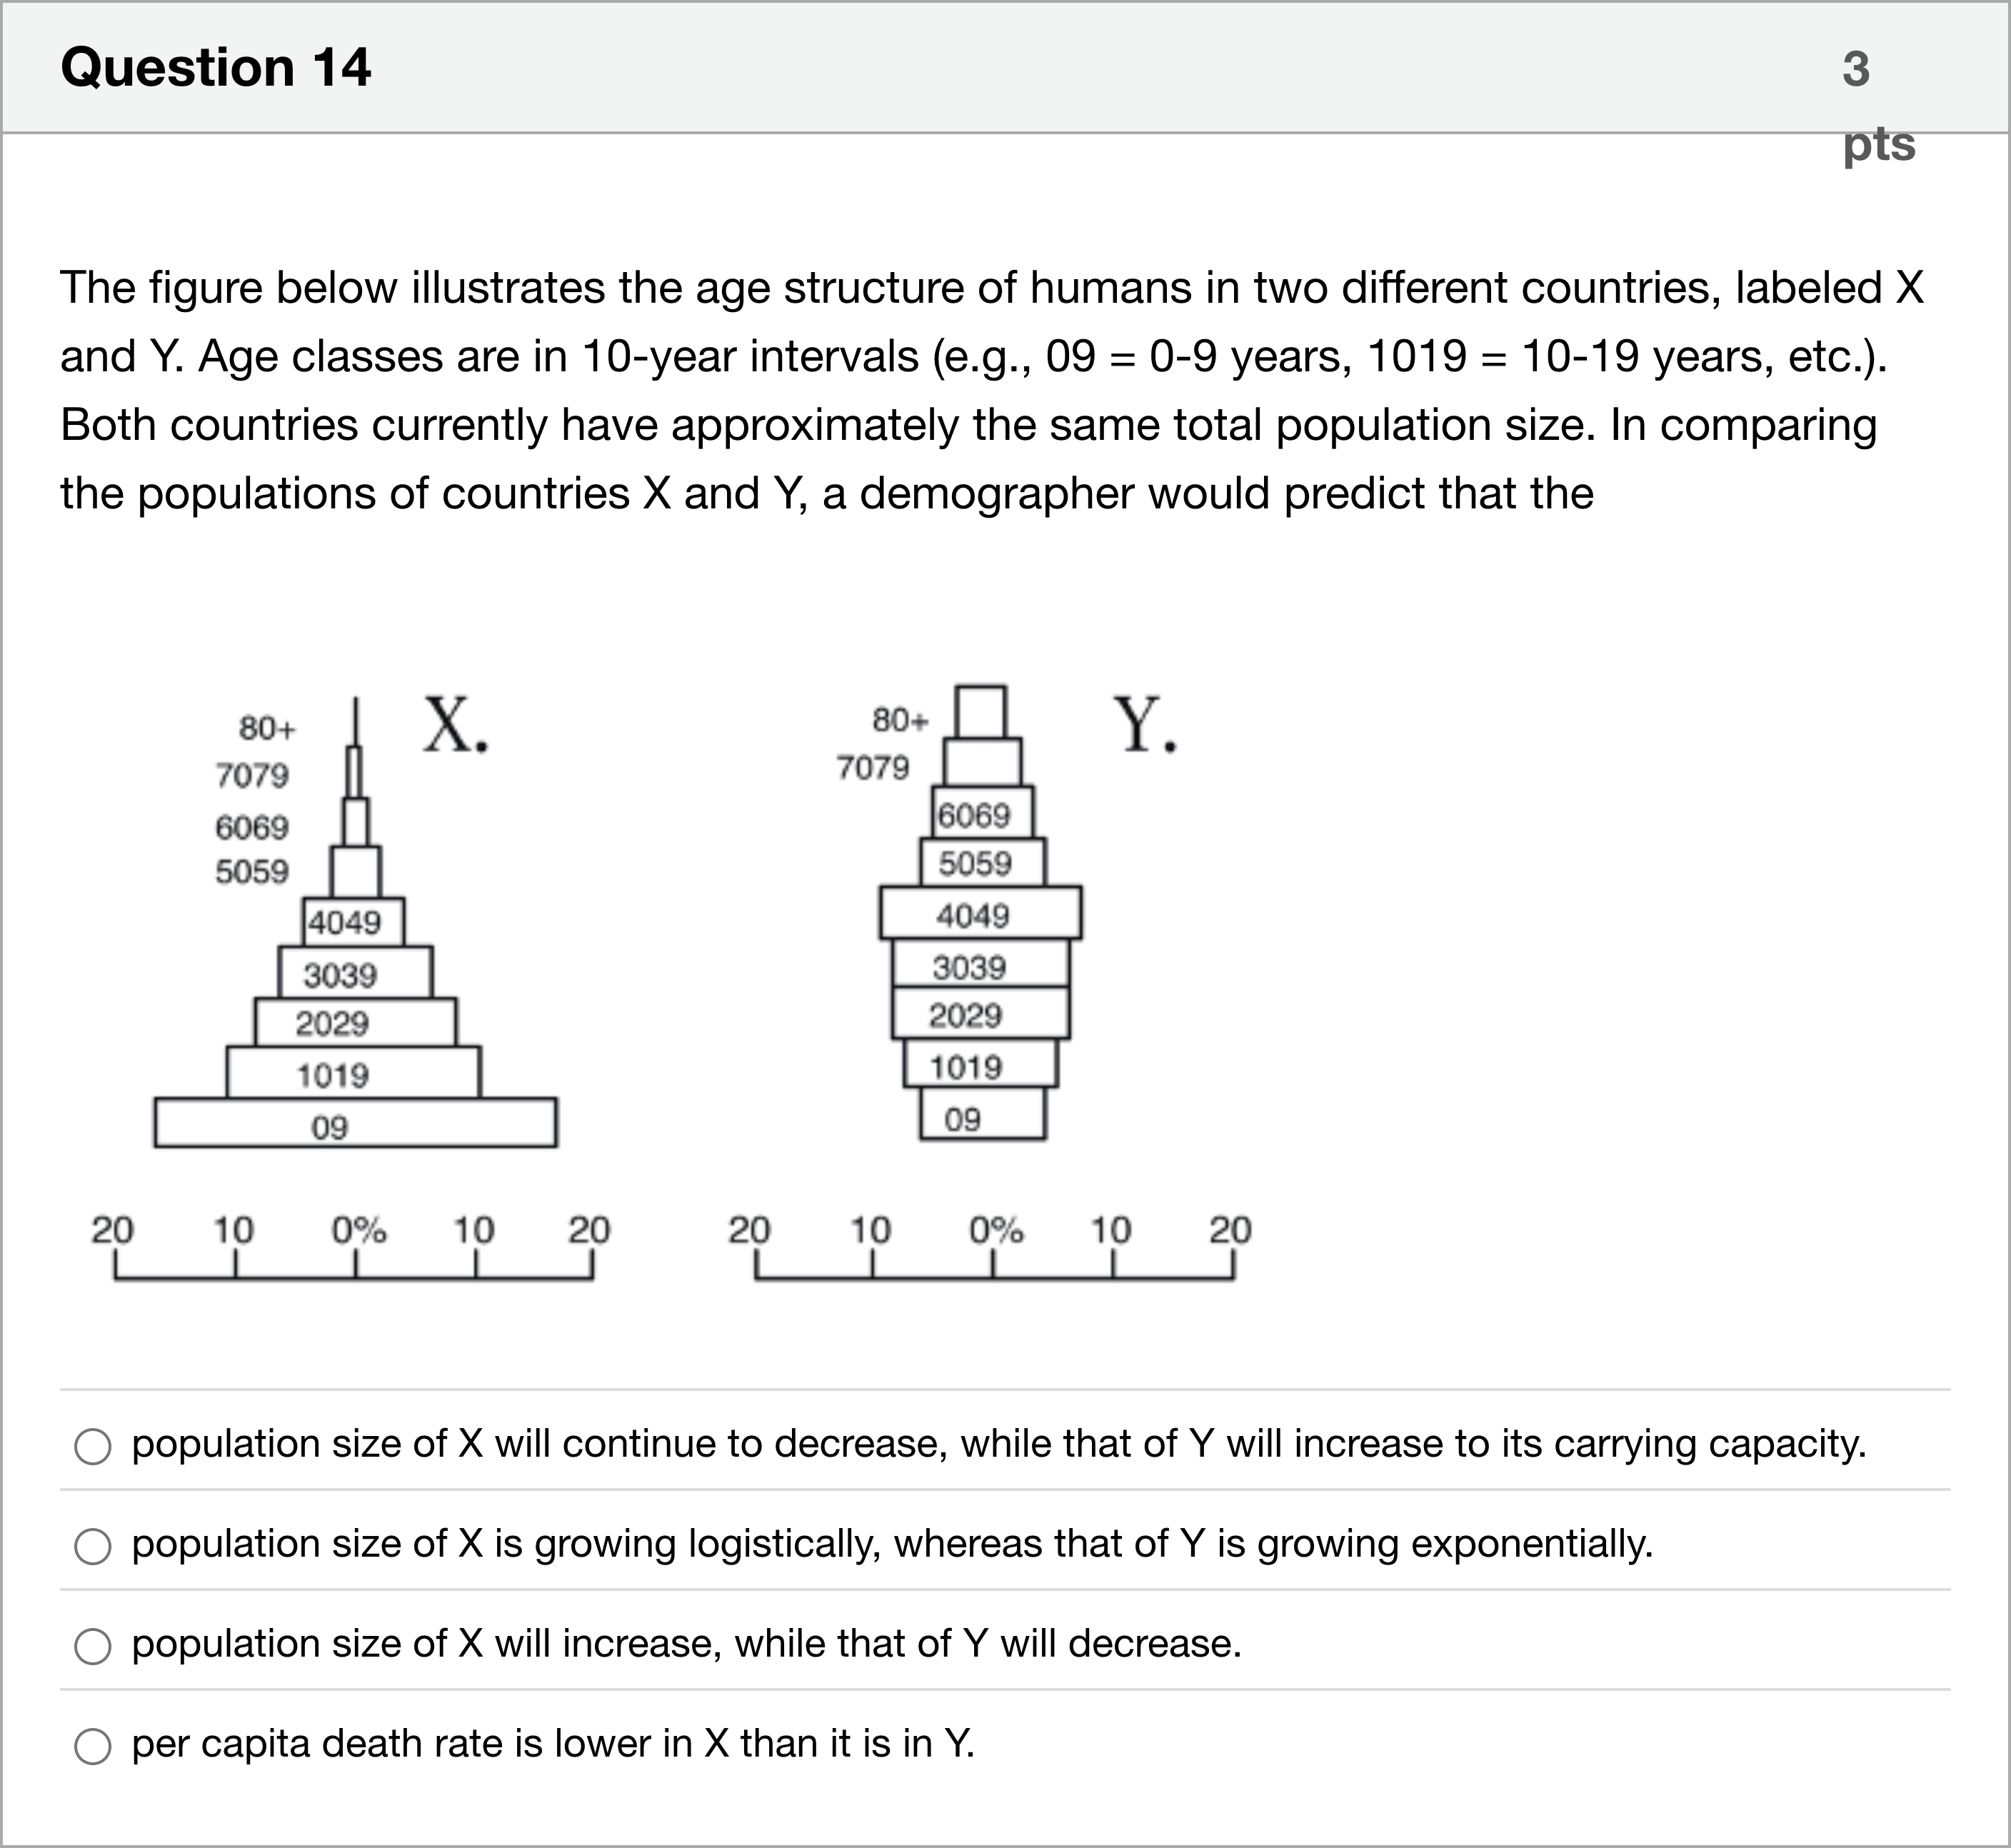
The figure below illustrates the age structure of humans in two different countries, labeled X and Y. Age classes are in 10-year intervals (e.g., 09 = 0-9 years, 1019 = 10-19 years, etc.). Both countries currently have approximately the same total population size. In comparing the populations of countries X and Y, a demographer would predict that the 单项选择题
A
population size of X will continue to decrease, while that of Y will increase to its carrying capacity.
B
population size of X is growing logistically, whereas that of Y is growing exponentially.
C
population size of X will increase, while that of Y will decrease.
D
per capita death rate is lower in X than it is in Y.
登录即可查看完整答案
我们收录了全球超50000道真实原题与详细解析,现在登录,立即获得答案。
类似问题
A grasshopper can be considered a pest when it is:
Which of the following best refers to the marginal user cost when harvesting leatherback sea turtle eggs from a nesting site beach?
Using Fig. 4, suppose lawmakers are concerned about the survival of a species and pass a law that bans hunting of that species from now on. Provided the law is successfully enforced, we should: Fig. 4 Population Model
In Fig. 6, the x-axis represents the resource stock X, and the y-axis shows the growth rate of the resource stock F(X) and the yield Y (a.k.a fishing mortality, catch, or harvest). The horizontal and vertical dashed lines divide the figure into four quadrants. The blue line is F(X). Fig. 6 Overfishing and Overfished In which quadrant(s) is the stock "overfished"?
更多留学生实用工具
希望你的学习变得更简单
加入我们,立即解锁 海量真题 与 独家解析,让复习快人一步!