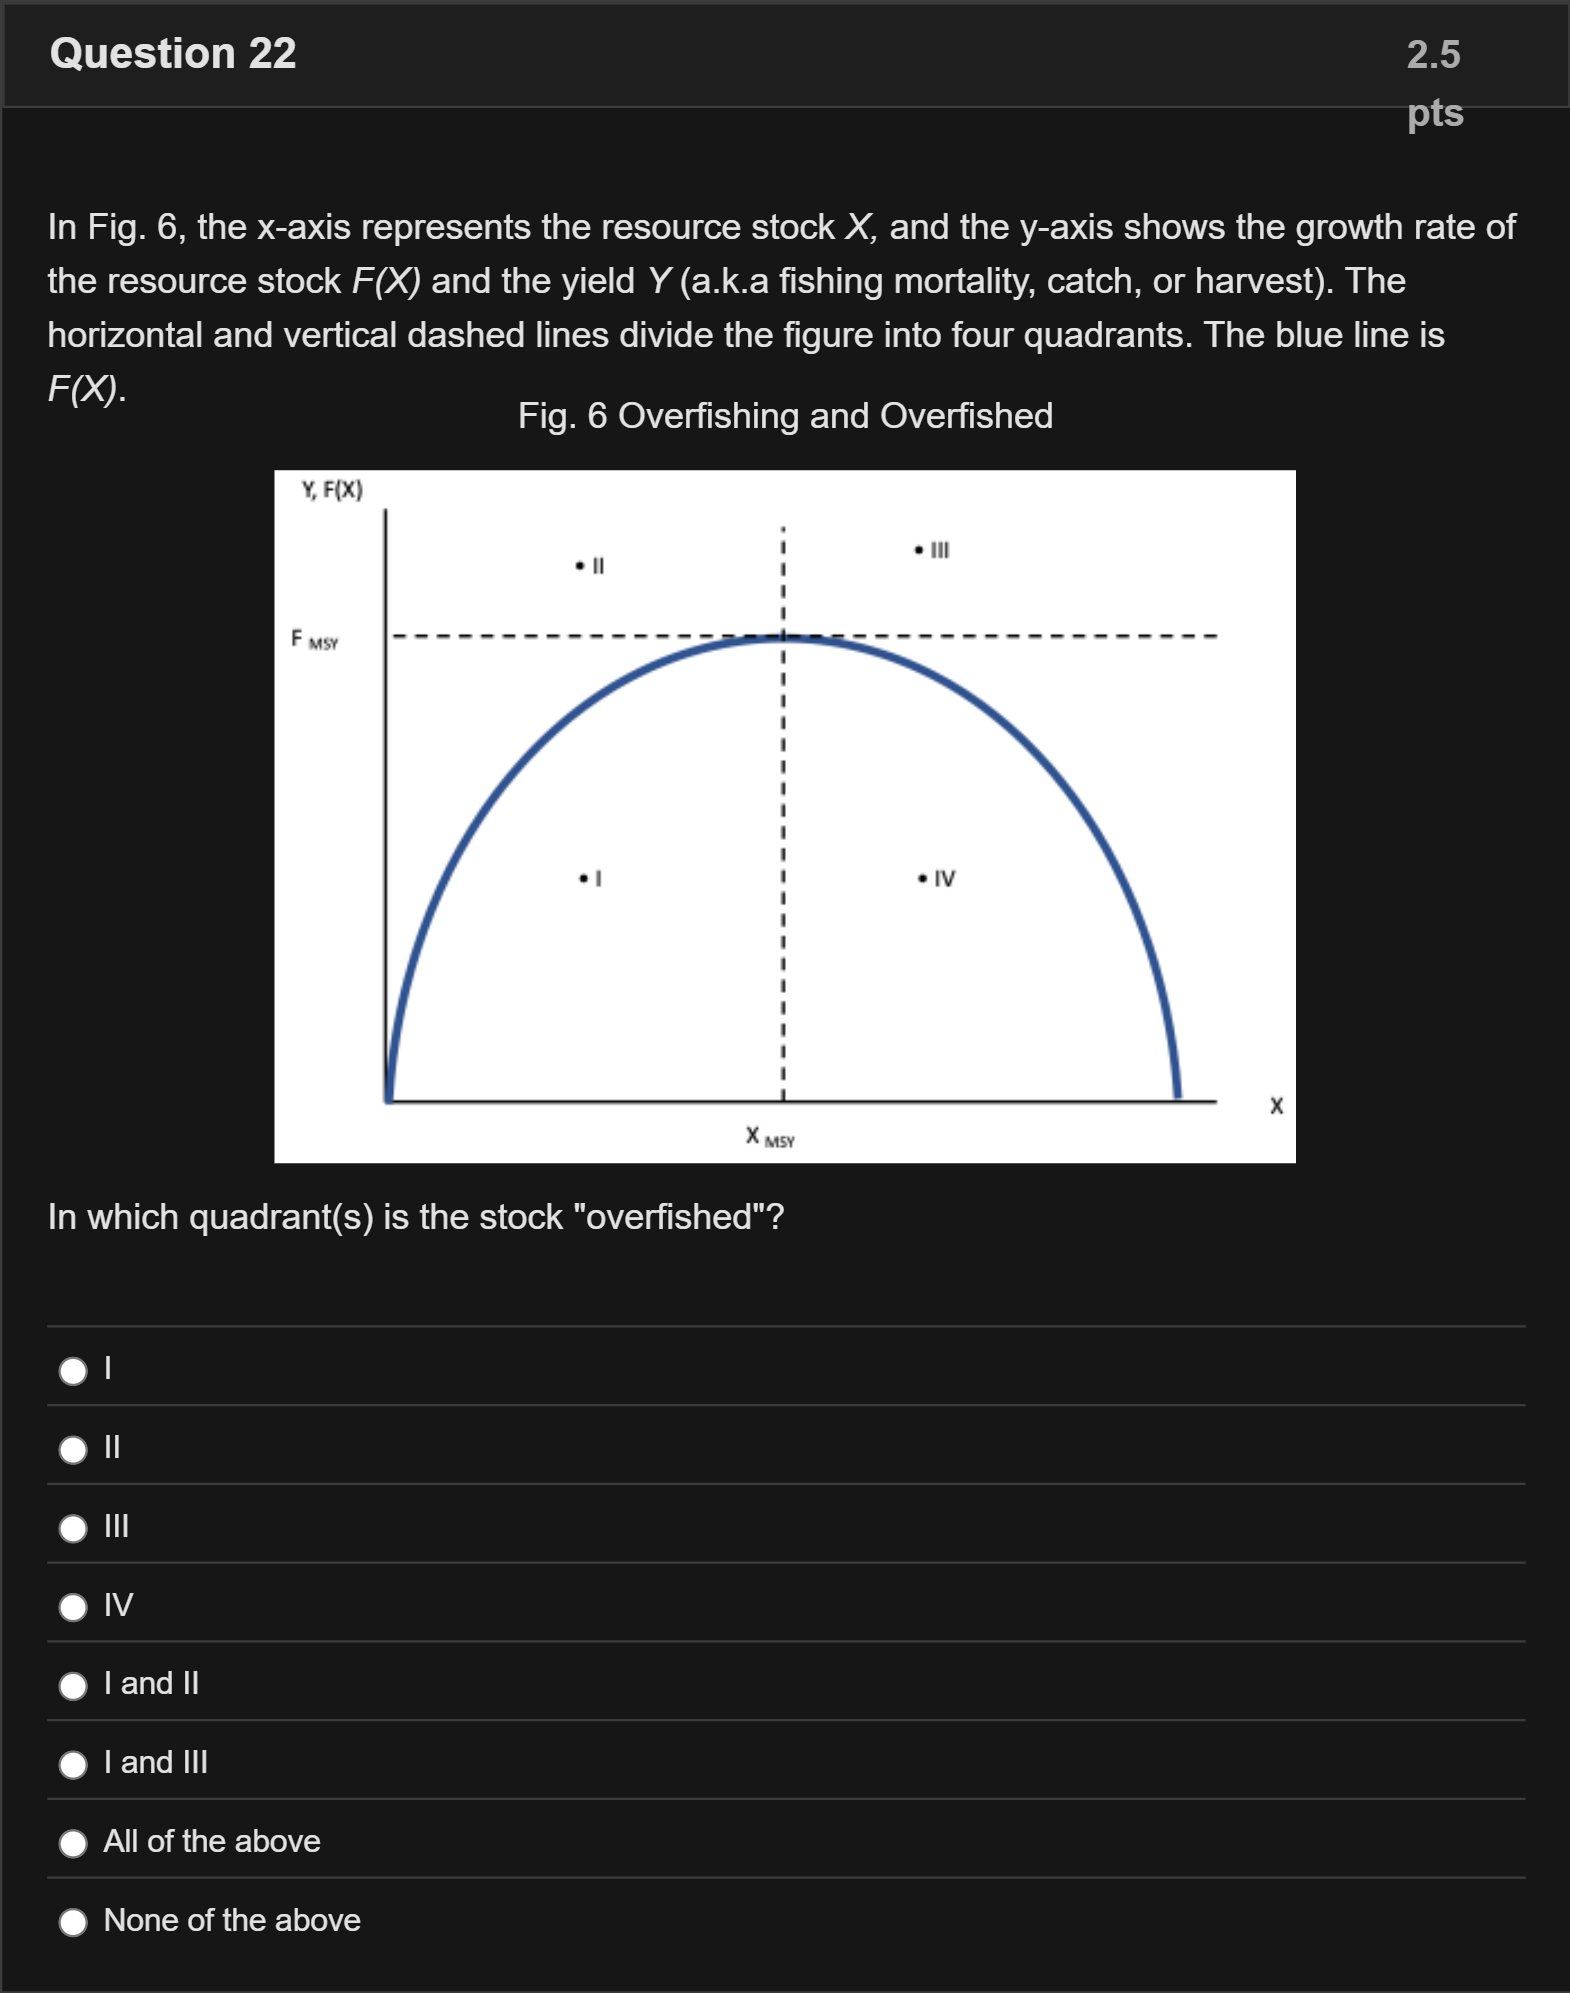
In Fig. 6, the x-axis represents the resource stock X, and the y-axis shows the growth rate of the resource stock F(X) and the yield Y (a.k.a fishing mortality, catch, or harvest). The horizontal and vertical dashed lines divide the figure into four quadrants. The blue line is F(X). Fig. 6 Overfishing and Overfished In which quadrant(s) is the stock "overfished"?单项选择题
A
I
B
II
C
III
D
IV
E
I and II
F
I and III
G
All of the above
H
None of the above
登录即可查看完整答案
我们收录了全球超50000道真实原题与详细解析,现在登录,立即获得答案。
类似问题
Question9 When trying to understand population dynamics, scientists typically focus on the status of:Select one alternative: males. adults. offspring. females. ResetMaximum marks: 1 Flag question undefined
A grasshopper can be considered a pest when it is:
Which of the following best refers to the marginal user cost when harvesting leatherback sea turtle eggs from a nesting site beach?
Using Fig. 4, suppose lawmakers are concerned about the survival of a species and pass a law that bans hunting of that species from now on. Provided the law is successfully enforced, we should: Fig. 4 Population Model
更多留学生实用工具
希望你的学习变得更简单
加入我们,立即解锁 海量真题 与 独家解析,让复习快人一步!