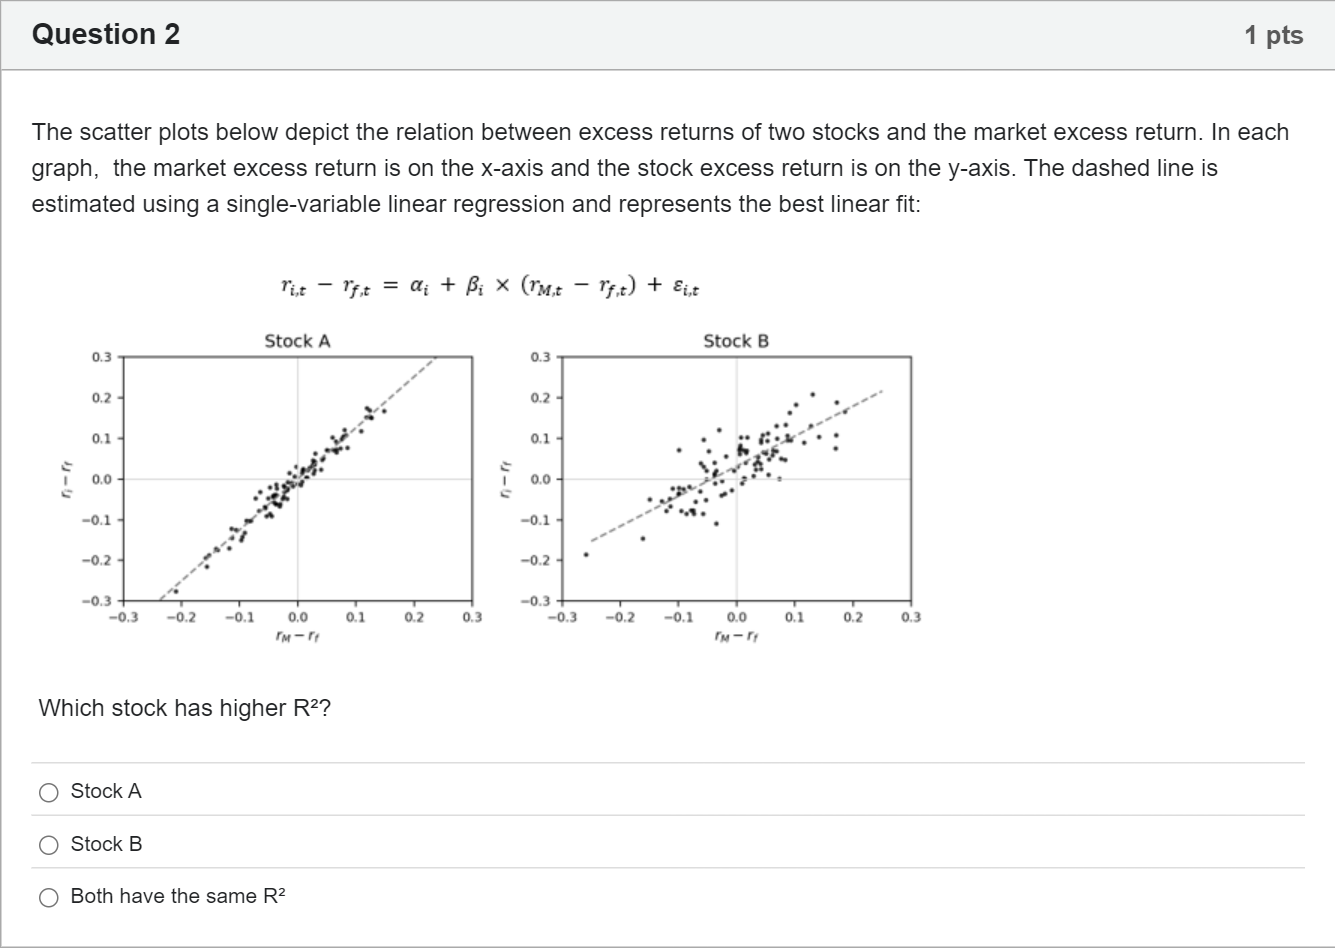
The scatter plots below depict the relation between excess returns of two stocks and the market excess return. In each graph, the market excess return is on the x-axis and the stock excess return is on the y-axis. The dashed line is estimated using a single-variable linear regression and represents the best linear fit: Which stock has higher R²?单项选择题
A
Stock A
B
Stock B
C
Both have the same R²
登录即可查看完整答案
我们收录了全球超50000道真实原题与详细解析,现在登录,立即获得答案。
类似问题
They decide to begin simply by running a model called m1 which has just one predictor variable (temperature) and the outcome variable meatballs. The output of that model is shown below. Coefficients: Estimate Std. Error t value Pr(>|t|) (Intercept) 113.7984 7.3137 15.56 <2e-16 *** temperature 8.3263 0.4848 17.17 <2e-16 *** --- Signif. codes: 0 ‘***’ 0.001 ‘**’ 0.01 ‘*’ 0.05 ‘.’ 0.1 ‘ ’ 1 Residual standard error: 60.57 on 363 degrees of freedom Multiple R-squared: 0.4483, Adjusted R-squared: 0.4467 F-statistic: 294.9 on 1 and 363 DF, p-value: < 2.2e-16 Which of the following best describes the relationship between temperature and meatballs?
Consider the regression model: 𝑦 = 𝛽 0 + 𝛽 1 𝑥 + 𝑢 . Which of the following is correct?
The regression line suggests that a 1000 points increase in SAT score raises college GPA by ...
The regression line suggests that a student whose SAT score is zero, that student is expected to earn a GPA of ...
更多留学生实用工具
希望你的学习变得更简单
加入我们,立即解锁 海量真题 与 独家解析,让复习快人一步!