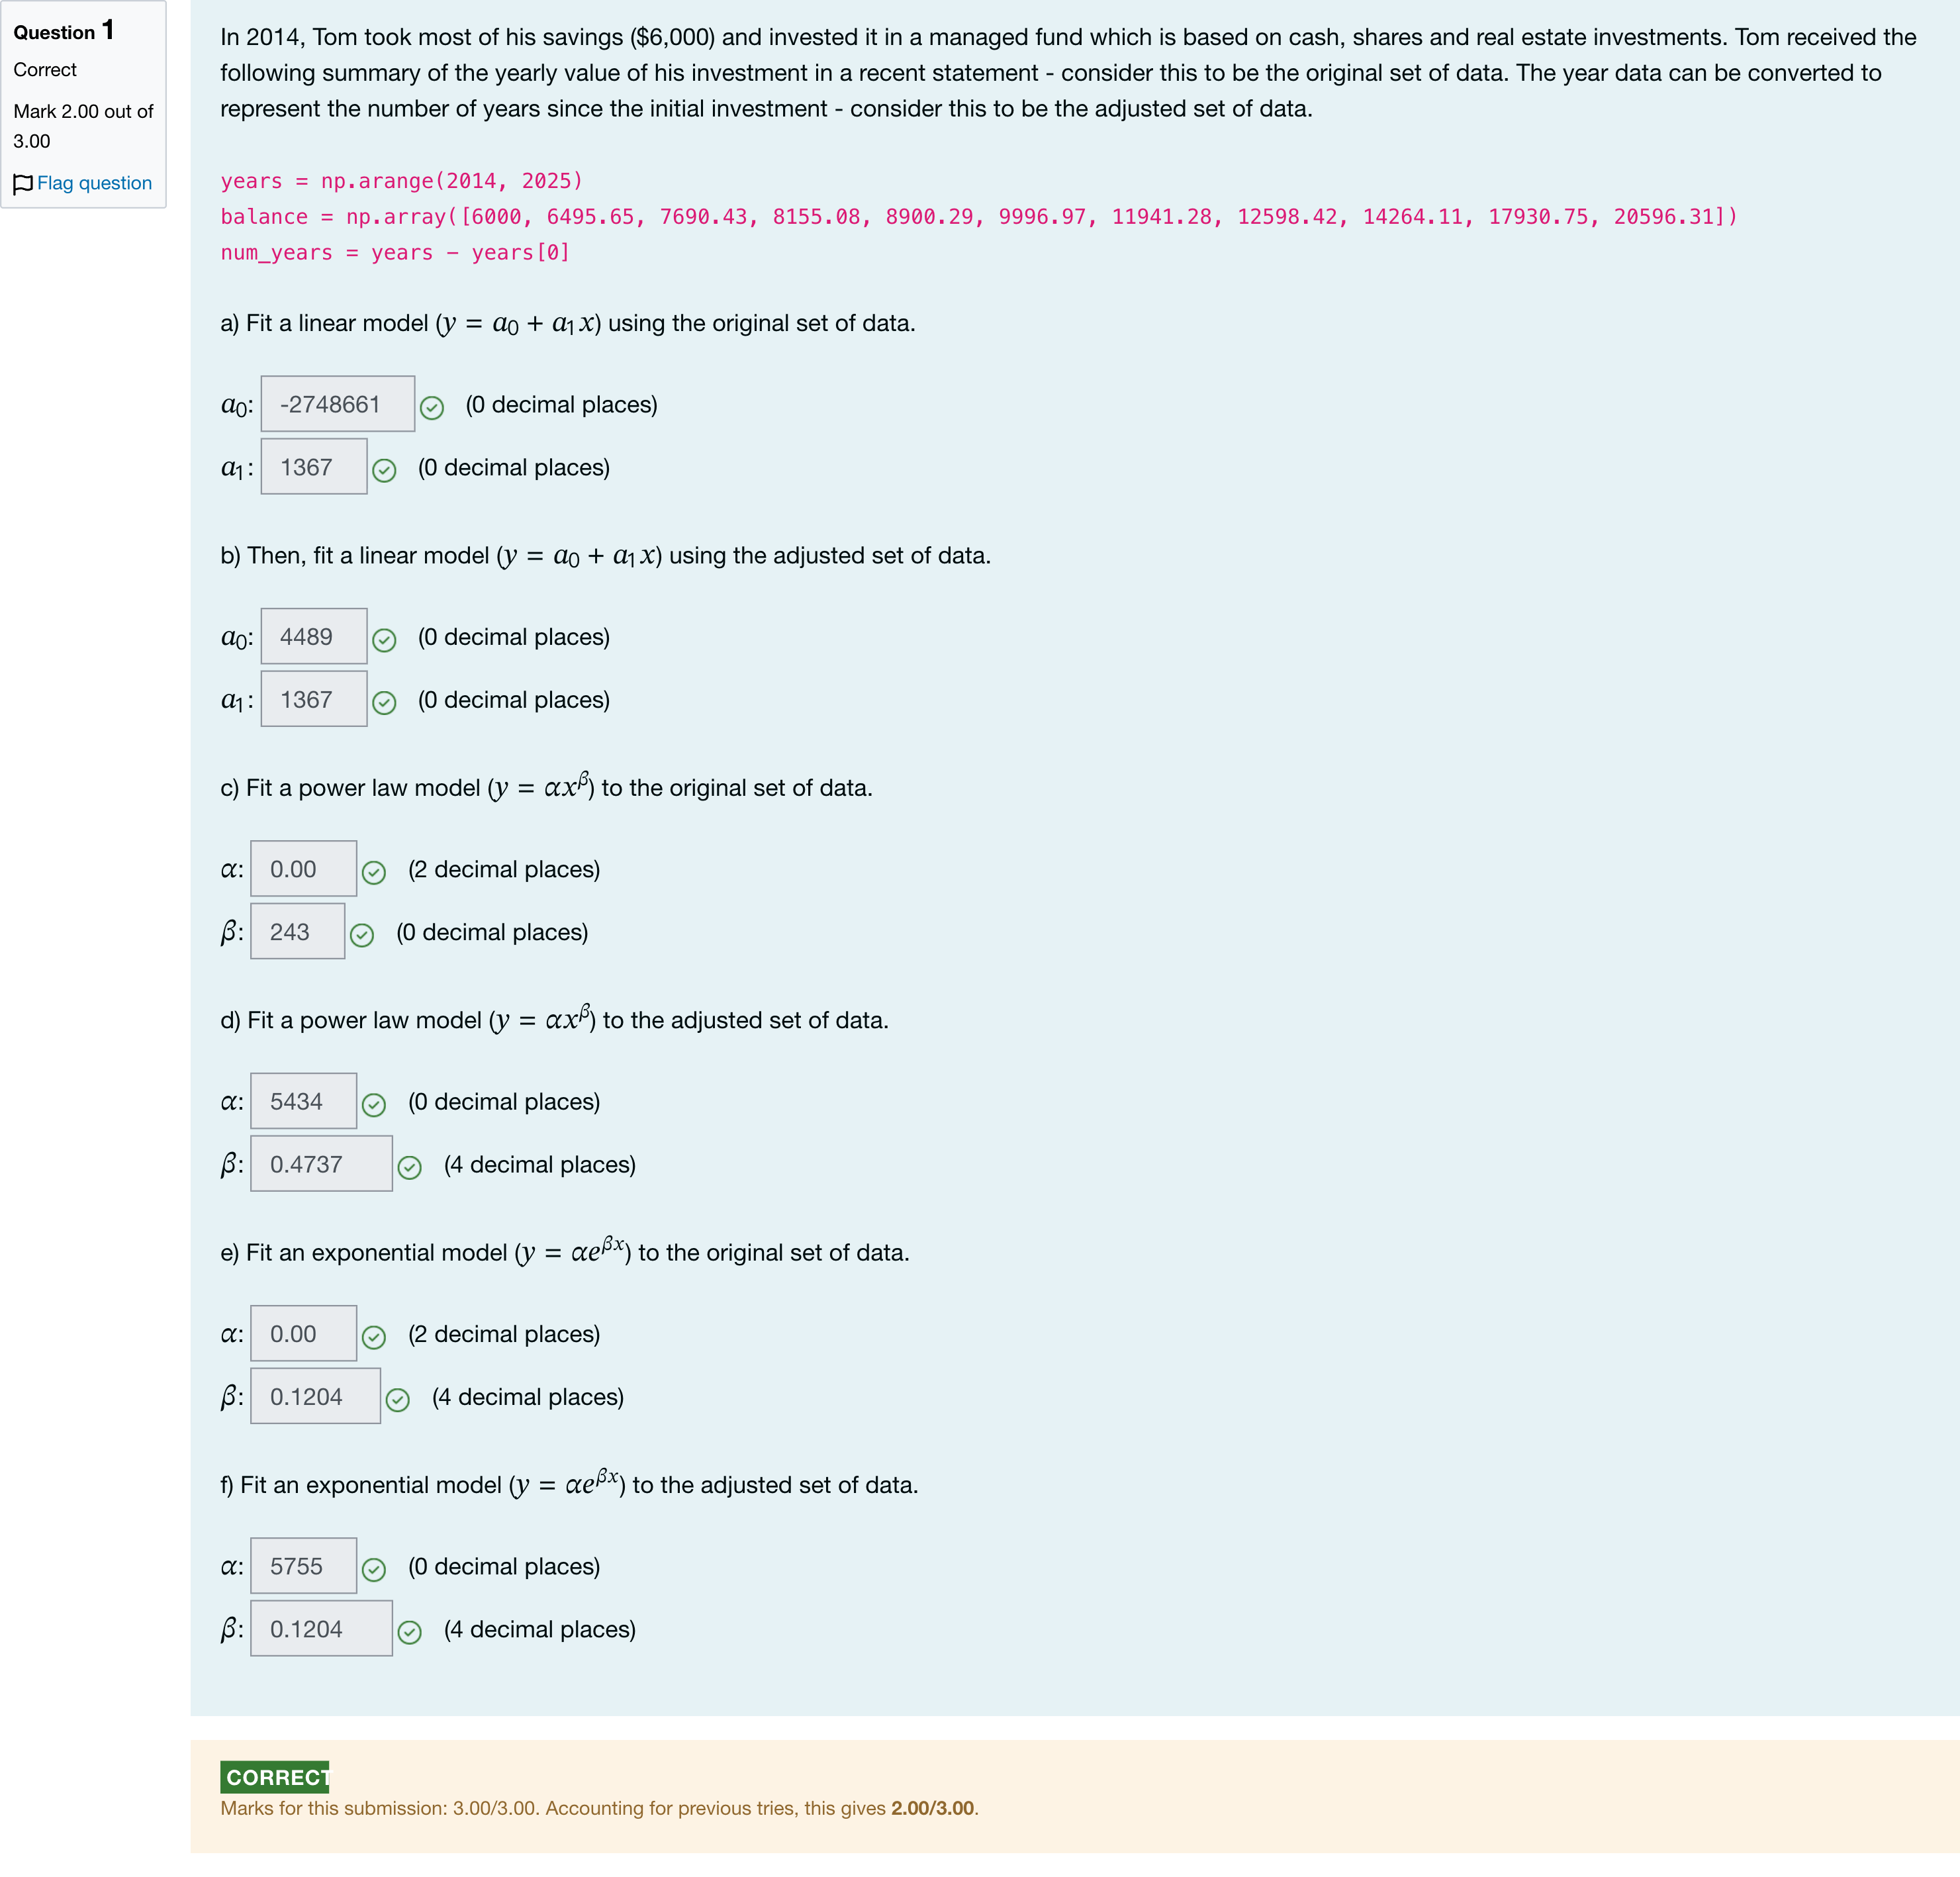
Question textIn 2014, Tom took most of his savings ($6,000) and invested it in a managed fund which is based on cash, shares and real estate investments. Tom received the following summary of the yearly value of his investment in a recent statement - consider this to be the original set of data. The year data can be converted to represent the number of years since the initial investment - consider this to be the adjusted set of data. years = np.arange(2014, 2025) balance = np.array([6000, 6495.65, 7690.43, 8155.08, 8900.29, 9996.97, 11941.28, 12598.42, 14264.11, 17930.75, 20596.31])num_years = years - years[0] a) Fit a linear model ([math: y=a0+a1x]) using the original set of data. [math: a0]: Answer 1 Question 1[input] (0 decimal places)[math: a1]: Answer 2 Question 1[input] (0 decimal places) b) Then, fit a linear model ([math: y=a0+a1x]) using the adjusted set of data.[math: a0]: Answer 3 Question 1[input] (0 decimal places)[math: a1]: Answer 4 Question 1[input] (0 decimal places) c) Fit a power law model ([math: y=αxβ]) to the original set of data. [math: α]: Answer 5 Question 1[input] (2 decimal places)[math: β]: Answer 6 Question 1[input] (0 decimal places) d) Fit a power law model ([math: y=αxβ]) to the adjusted set of data. [math: α]: Answer 7 Question 1[input] (0 decimal places)[math: β]: Answer 8 Question 1[input] (4 decimal places) e) Fit an exponential model ([math: y=αeβx]) to the original set of data. [math: α]: Answer 9 Question 1[input] (2 decimal places)[math: β]: Answer 10 Question 1[input] (4 decimal places)f) Fit an exponential model ([math: y=αeβx]) to the adjusted set of data. [math: α]: Answer 11 Question 1[input] (0 decimal places)[math: β]: Answer 12 Question 1[input] (4 decimal places)多项填空题
登录即可查看完整答案
我们收录了全球超50000道真实原题与详细解析,现在登录,立即获得答案。
类似问题
The scatter plots below depict the relation between excess returns of two stocks and the market excess return. In each graph, the market excess return is on the x-axis and the stock excess return is on the y-axis. The dashed line is estimated using a single-variable linear regression and represents the best linear fit: Which stock has higher R²?
They decide to begin simply by running a model called m1 which has just one predictor variable (temperature) and the outcome variable meatballs. The output of that model is shown below. Coefficients: Estimate Std. Error t value Pr(>|t|) (Intercept) 113.7984 7.3137 15.56 <2e-16 *** temperature 8.3263 0.4848 17.17 <2e-16 *** --- Signif. codes: 0 ‘***’ 0.001 ‘**’ 0.01 ‘*’ 0.05 ‘.’ 0.1 ‘ ’ 1 Residual standard error: 60.57 on 363 degrees of freedom Multiple R-squared: 0.4483, Adjusted R-squared: 0.4467 F-statistic: 294.9 on 1 and 363 DF, p-value: < 2.2e-16 Which of the following best describes the relationship between temperature and meatballs?
Consider the regression model: 𝑦 = 𝛽 0 + 𝛽 1 𝑥 + 𝑢 . Which of the following is correct?
The regression line suggests that a 1000 points increase in SAT score raises college GPA by ...
更多留学生实用工具
希望你的学习变得更简单
加入我们,立即解锁 海量真题 与 独家解析,让复习快人一步!