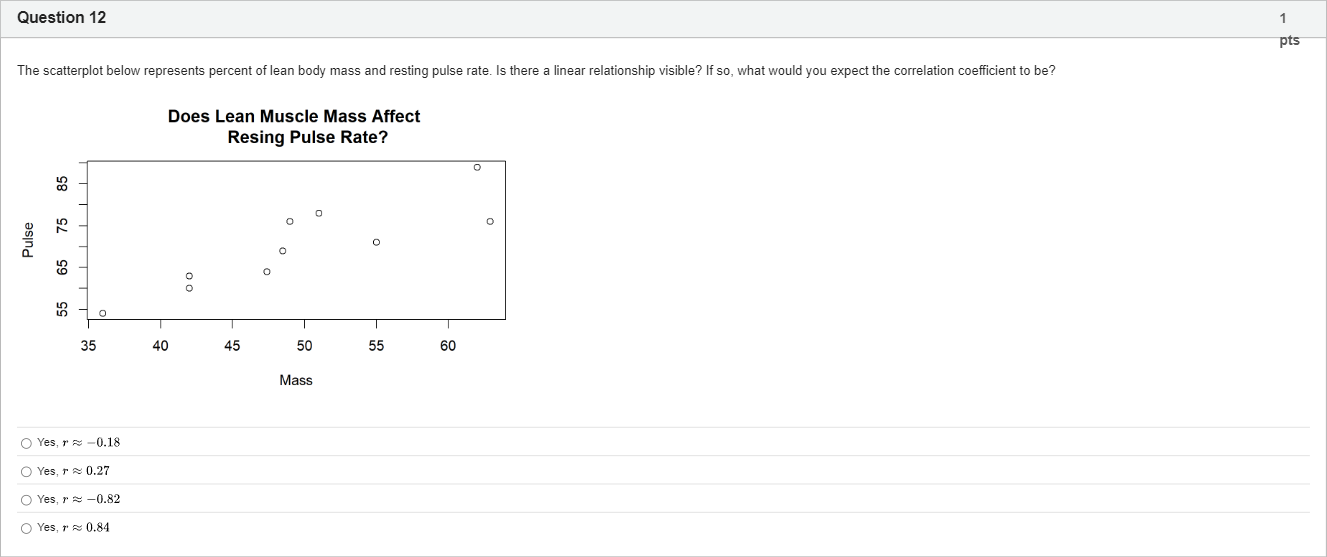
The scatterplot below represents percent of lean body mass and resting pulse rate. Is there a linear relationship visible? If so, what would you expect the correlation coefficient to be?单项选择题
A
Yes, 𝑟 ≈ − 0.18
B
Yes, 𝑟 ≈ 0.27
C
Yes, 𝑟 ≈ − 0.82
D
Yes, 𝑟 ≈ 0.84
登录即可查看完整答案
我们收录了全球超50000道真实原题与详细解析,现在登录,立即获得答案。
类似问题
The value of the theoretical reliability coefficient can vary between:
The birth weight and weight at age 21 of eight women are given in the table below. [table] Birth weight (kg) | 1.9 | 2.4 | 2.6 | 2.7 | 2.9 | 3.2 | 3.4 | 3.6 Weight at 21 (kg) | 47.6 | 53.1 | 52.2 | 56.2 | 57.6 | 59.9 | 55.3 | 56.7 [/table] The value of the correlation coefficient is closest to:
A set of bivariate data involving the variables [math: x] and [math: y] undergoes a statistical analysis. A summary of that analysis is shown in the table below.The equation of the least squares regression line is [math: y=5.14−1.25x].The value of the Pearson's correlation coefficient is closest to
The birth weight and weight at age 21 of eight women are given in the table below. The value of the correlation coefficient is closest to:
更多留学生实用工具
希望你的学习变得更简单
加入我们,立即解锁 海量真题 与 独家解析,让复习快人一步!