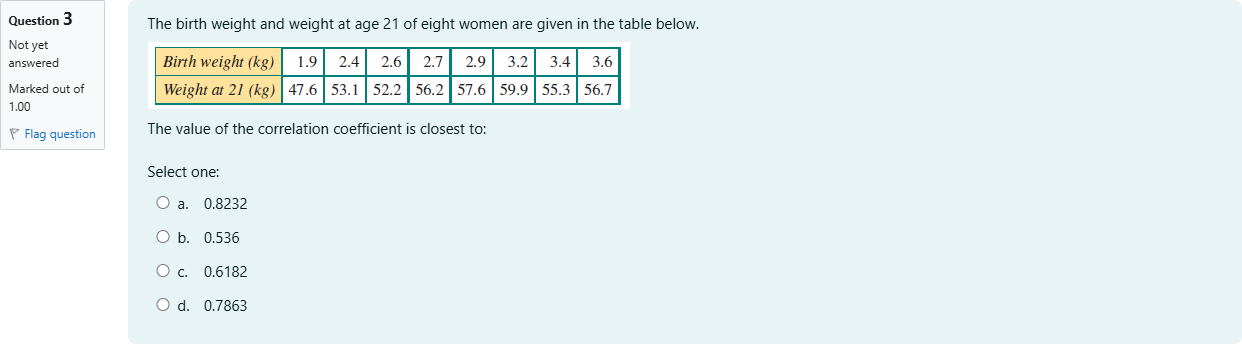
The birth weight and weight at age 21 of eight women are given in the table below. The value of the correlation coefficient is closest to:单项选择题
A
a. 0.8232
B
b. 0.536
C
c. 0.6182
D
d. 0.7863
登录即可查看完整答案
我们收录了全球超50000道真实原题与详细解析,现在登录,立即获得答案。
类似问题
The value of the theoretical reliability coefficient can vary between:
The birth weight and weight at age 21 of eight women are given in the table below. [table] Birth weight (kg) | 1.9 | 2.4 | 2.6 | 2.7 | 2.9 | 3.2 | 3.4 | 3.6 Weight at 21 (kg) | 47.6 | 53.1 | 52.2 | 56.2 | 57.6 | 59.9 | 55.3 | 56.7 [/table] The value of the correlation coefficient is closest to:
The scatterplot below represents percent of lean body mass and resting pulse rate. Is there a linear relationship visible? If so, what would you expect the correlation coefficient to be?
A set of bivariate data involving the variables [math: x] and [math: y] undergoes a statistical analysis. A summary of that analysis is shown in the table below.The equation of the least squares regression line is [math: y=5.14−1.25x].The value of the Pearson's correlation coefficient is closest to
更多留学生实用工具
希望你的学习变得更简单
加入我们,立即解锁 海量真题 与 独家解析,让复习快人一步!