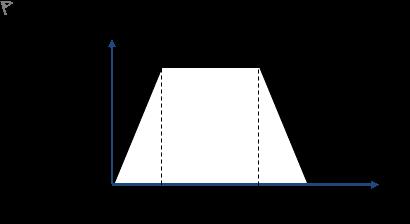
The graph shows the speed of a remote controlled toy car travelling along a race track. The car's displacement (in metres) can be calculated from the area under this graph. What is it? Give your answer to 3 significant figures.数值题
登录即可查看完整答案
我们收录了全球超50000道真实原题与详细解析,现在登录,立即获得答案。
类似问题
An object's movement is depicted by the following motion graph. [NOT DRAWN TO SCALE]The particle's displacement, [math: x], is 244.7 m during the motion Find the maximum velocity, [math: v], of the particle given the following values.A : 7.8 sB : 15.7 sC : 25.8 s
An object's motion is illustrated using the graph below. (NOT DRAWN TO SCALE)Determine the total displacement of the object given the following values:A : 18.1 ms-1B : -7.8 ms-1C : 8.5 sD : 16.9 s
An object's movement is depicted by the following motion graph. [NOT DRAWN TO SCALE]The particle's displacement, [math: x], is 236.9 m during the motion Find the maximum velocity, [math: v], of the particle given the following values.A : 8.9 sB : 18.9 sC : 27.7 s
The figure shows the v-t graph of a truck moving on the road. The distance travelled in the first 8 seconds is
更多留学生实用工具
希望你的学习变得更简单
加入我们,立即解锁 海量真题 与 独家解析,让复习快人一步!