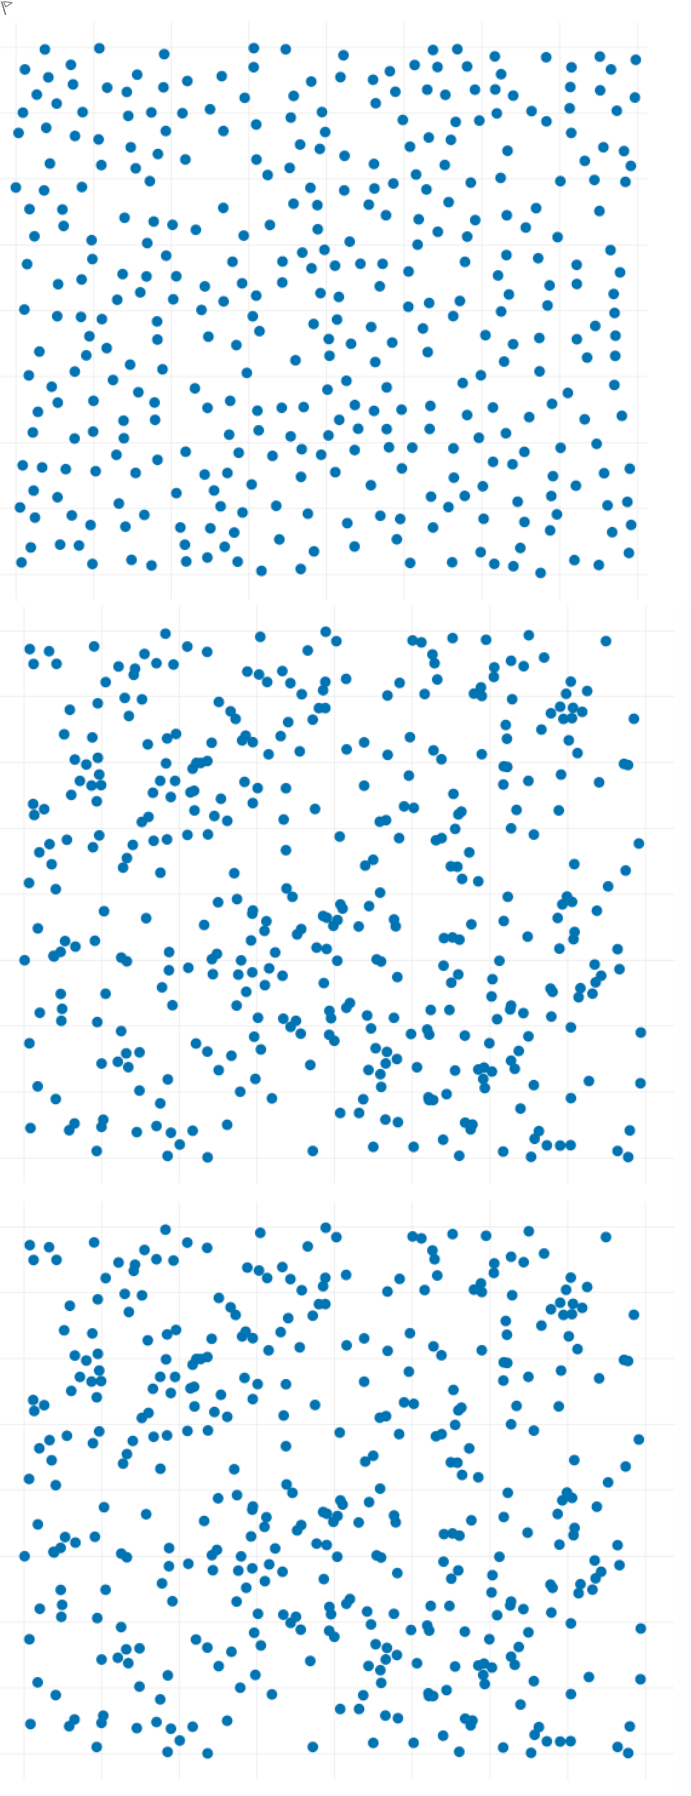
Which one of these images shows data generated uniformly at random?单项选择题
登录即可查看完整答案
我们收录了全球超50000道真实原题与详细解析,现在登录,立即获得答案。
类似问题
Question at position 1 The shape of the uniform probability distribution is:positively skewed.negatively skewed.bell-shaped.rectangular
It is hypothesized that a population has a uniform distribution between 0 and 10.2. A goodness of fit will be performed to decide if this hypothesis is correct. To perform this test, each observed data value X will need to be categorized. It is decided that the categories should be as follows: Category 1 2 3 4 5 x=observation 0 <= X <= 2 2 < X <= 4.1 4.1 < X <= 6 6 < X <= 7.9 7.9 < X <=10.2 If this hypothesis is correct, what proportion of observations should be in Category 3?
The assembly time for a product is uniformly distributed between 6 to 10 minutes. The probability of assembling the product in less than 6 minutes is
The height of the probability density function f(x) of a random variable X that is uniformly distributed between a and b is:
更多留学生实用工具
希望你的学习变得更简单
加入我们,立即解锁 海量真题 与 独家解析,让复习快人一步!