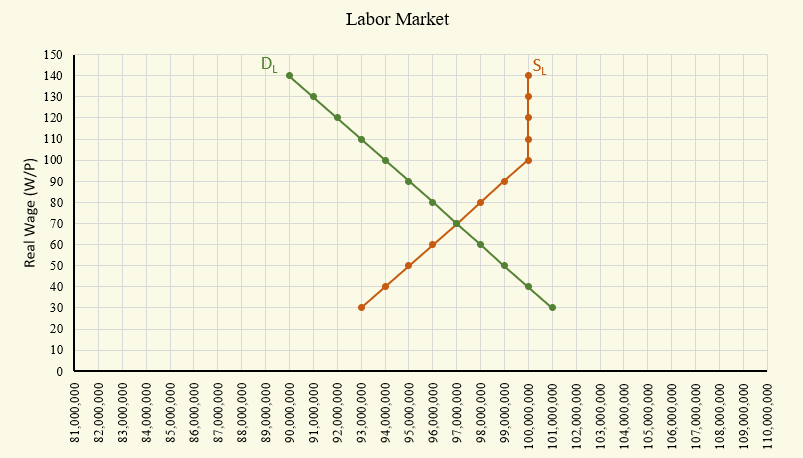
Consider the Labor Market Graph above. This graph shows the labor market condition in a hypothetical country. The natural rate of unemployment in this country is 6 percent. In other words, even during normal times 6 percent of the labor force is unemployed. The natural unemployment is due to a combination of frictional and structural reasons. The potential GDP in this country equals YP = 10,000,000. Okun's alpha equals 2. Currently, the nominal wage rate is W = 12,000 and the general price level is P = 120. As a result, currently: Real wage = [Fill in the blank], Natural rate of unemployment = [Fill in the blank], percent Cyclical rate of unemployment = [Fill in the blank], percent Overall rate of unemployment = [Fill in the blank], percent Real GDP in this country equals [Fill in the blank], units. The pdf file "HW3 Graph and Explanation" in the folder Homework Graphs explains the shape of the supply function. Basically, the graph assumes that the maximum number of people who are willing and able to work does not exceed 100 million due to population constraint. 多项填空题
登录即可查看完整答案
我们收录了全球超50000道真实原题与详细解析,现在登录,立即获得答案。
类似问题
The natural rate of unemployment is zero because a healthy economy should have everyone employed.
A hotel manager in Montreux notices that during winter off-season, 15% of hospitality workers are temporarily laid off. This type of unemployment is called:
Switzerland's unemployment rate is approximately 2.3% (2024). An economist would describe this as:
The business cycle fluctuations cause frictional unemployment in the economy, and this unemployment can be eliminated by providing more job networks.
更多留学生实用工具
希望你的学习变得更简单
加入我们,立即解锁 海量真题 与 独家解析,让复习快人一步!