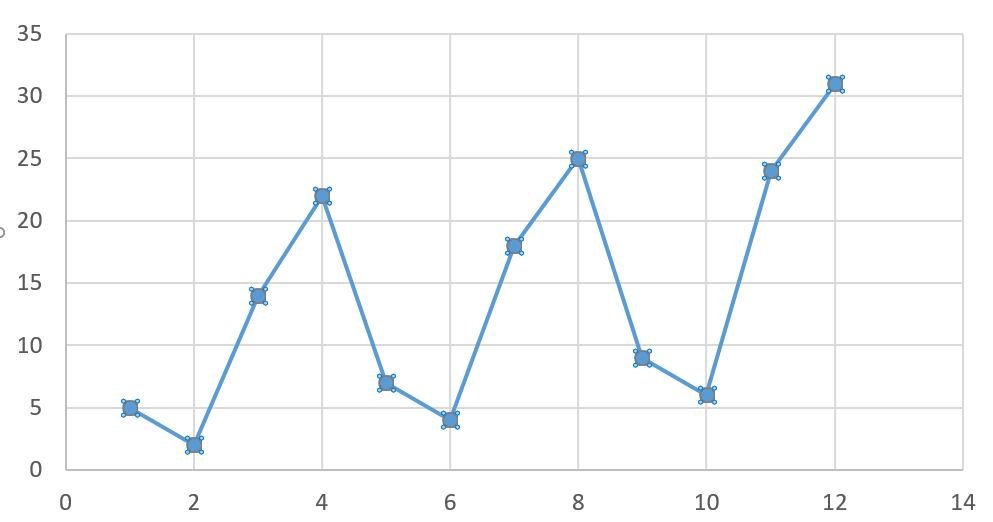
The above chart shows demand for leafblowers at a small hardware store. Which of the following describes the trend present in the graph?单项选择题
登录即可查看完整答案
我们收录了全球超50000道真实原题与详细解析,现在登录,立即获得答案。
类似问题
How many years of data are needed for trend analysis?
One way to think about the possibilities of the future based is to examine ________ based on historical and current data.
The percentage of people reporting that they are stressed has increased throughout the years.
Use the text and the graph about a government digital analytics program launched in 2013 to answer the question that follows. Source 1 Mobile traffic had a strong and steady growth from just 13% of all visitors on government websites in 2013 to nearly six out of ten (58%) visitors in 2023. The majority of mobile visitors (56%) used Apple iPhones when on government websites. In contrast, desktop visitors declined from 80% in 2013 to 40% in 2023. For desktop browsers, 43% of visitors used Chrome, 35% were on Safari, and 7% used Internet Explorer. Source 2 Which source of information above best answers the question “How did user behavior change from year to year between 2013 and 2023?”
更多留学生实用工具
希望你的学习变得更简单
加入我们,立即解锁 海量真题 与 独家解析,让复习快人一步!