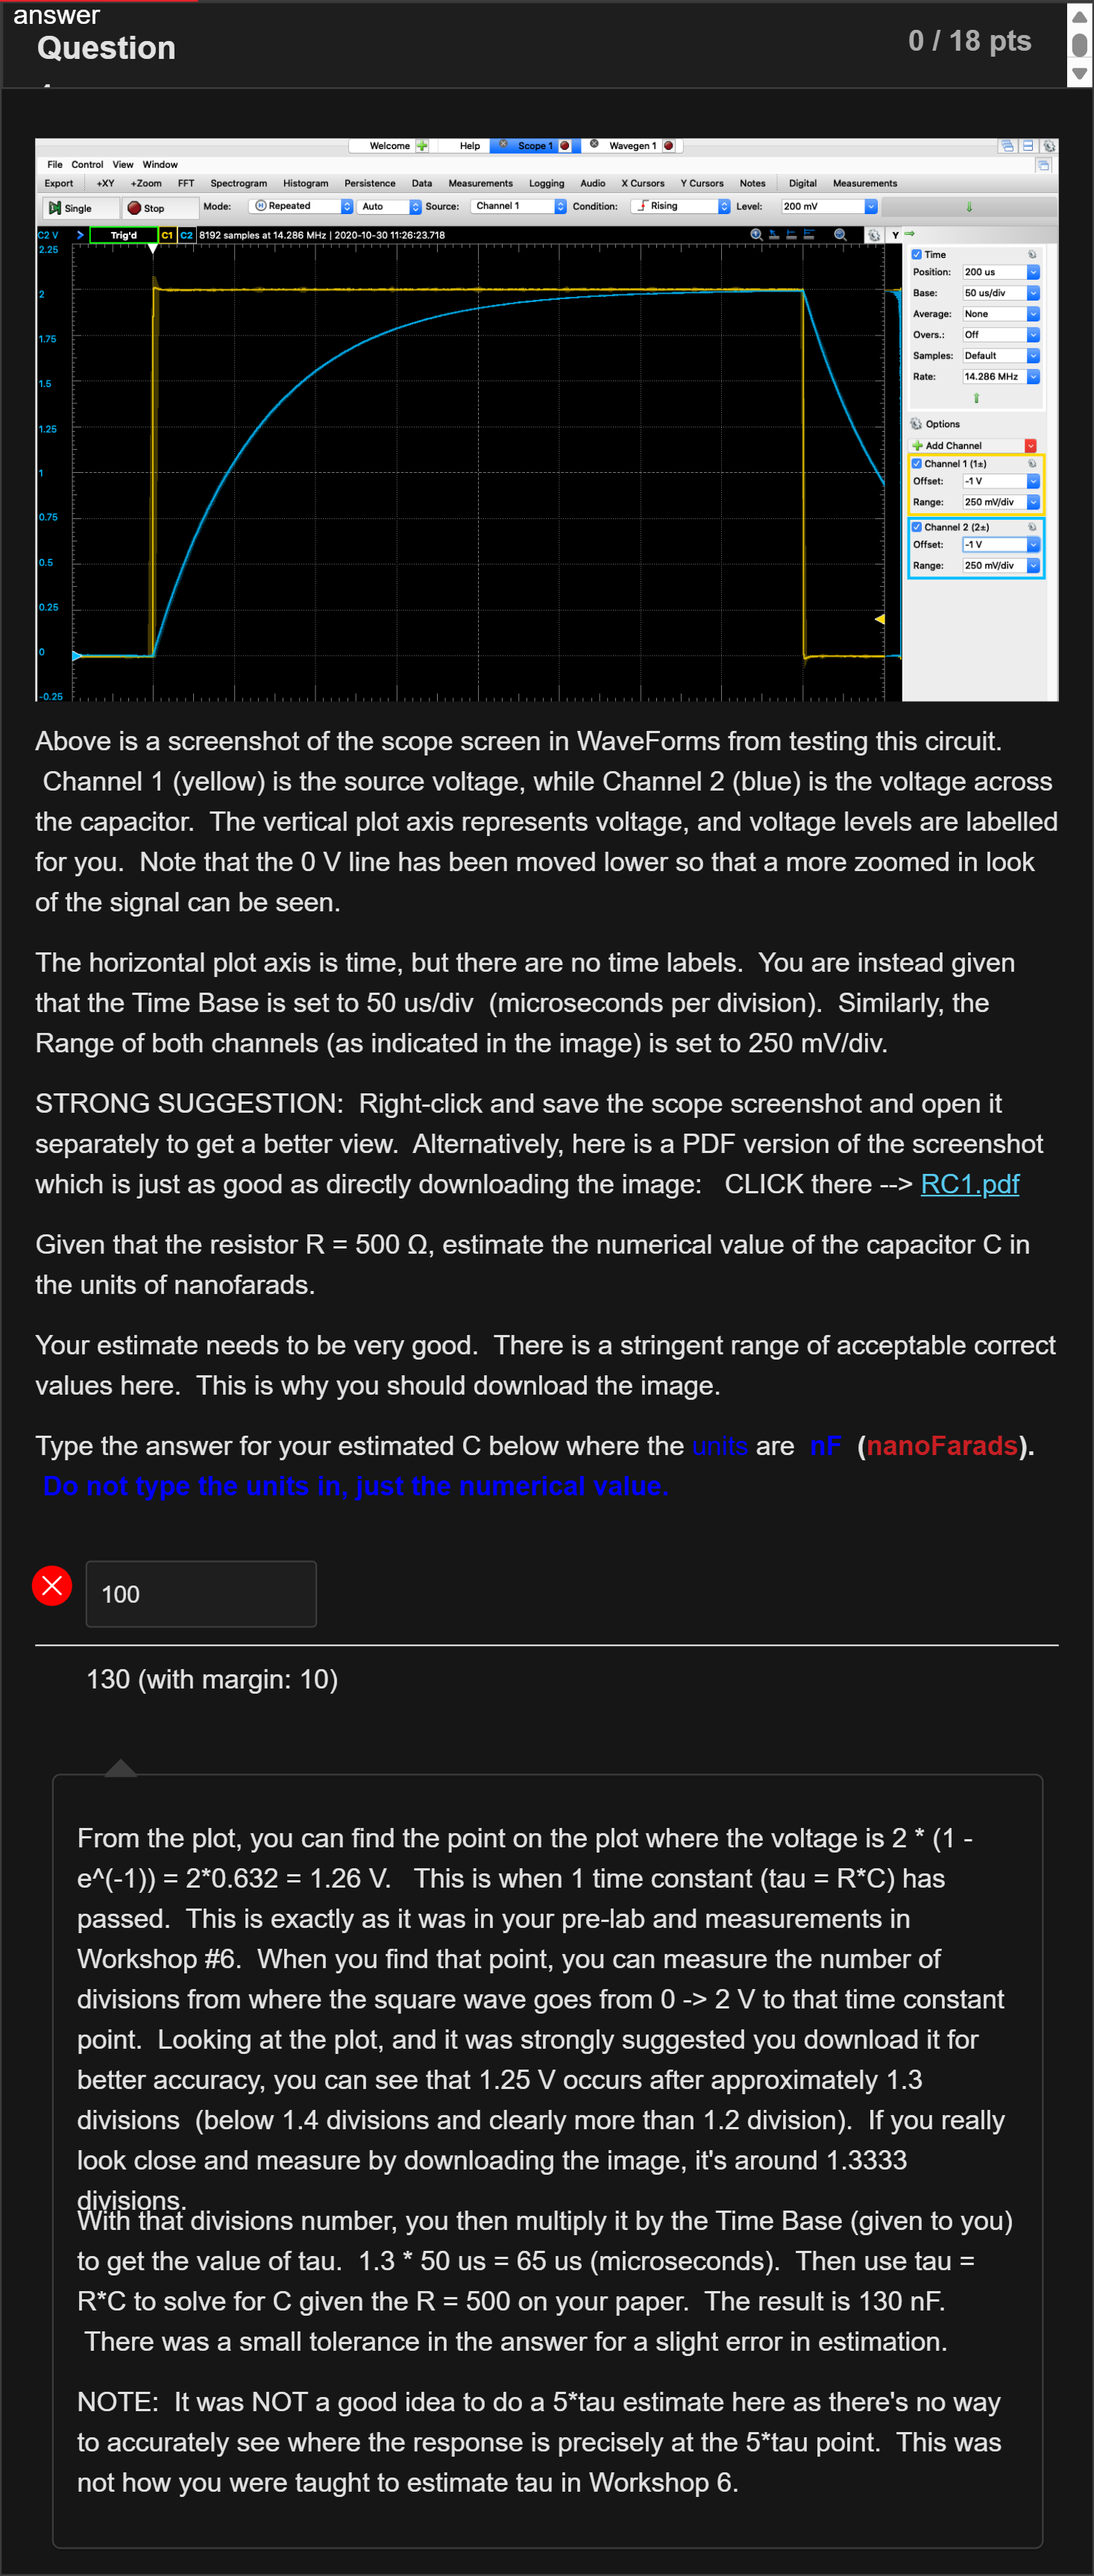
Above is a screenshot of the scope screen in WaveForms from testing this circuit. Channel 1 (yellow) is the source voltage, while Channel 2 (blue) is the voltage across the capacitor. The vertical plot axis represents voltage, and voltage levels are labelled for you. Note that the 0 V line has been moved lower so that a more zoomed in look of the signal can be seen. The horizontal plot axis is time, but there are no time labels. You are instead given that the Time Base is set to 50 us/div (microseconds per division). Similarly, the Range of both channels (as indicated in the image) is set to 250 mV/div. STRONG SUGGESTION: Right-click and save the scope screenshot and open it separately to get a better view. Alternatively, here is a PDF version of the screenshot which is just as good as directly downloading the image: CLICK there --> RC1.pdf Given that the resistor R = 500 Ω, estimate the numerical value of the capacitor C in the units of nanofarads. Your estimate needs to be very good. There is a stringent range of acceptable correct values here. This is why you should download the image. Type the answer for your estimated C below where the units are nF (nanoFarads). Do not type the units in, just the numerical value. 数值题
登录即可查看完整答案
我们收录了全球超50000道真实原题与详细解析,现在登录,立即获得答案。
类似问题
The time constant for capacitors states that
Again consider the RC circuit shown before Question #1. An experiment was run and the resulting traces of the source voltage (yellow) and capacitor voltage (blue) are shown below. The source voltage is a square wave of some frequency f and goes from 0 V to 2 V, then back to 0 V as you used in your Workshop #6. It should be clear the capacitor voltage does not achieve steady state as it never reaches the source voltage. Consider the possibility of changing the component values of R and C. Which of the below choices regarding the change in R and C can help the capacitor's voltage get closer to achieving steady state:
In the filter circuits, the time constant of the circuit is given by
Is the following statement true or false? In the products of methylation-hydrolysis, every -OH group corresponds to the position of a glycosidic bond in the starting polysaccharide.
更多留学生实用工具
希望你的学习变得更简单
加入我们,立即解锁 海量真题 与 独家解析,让复习快人一步!