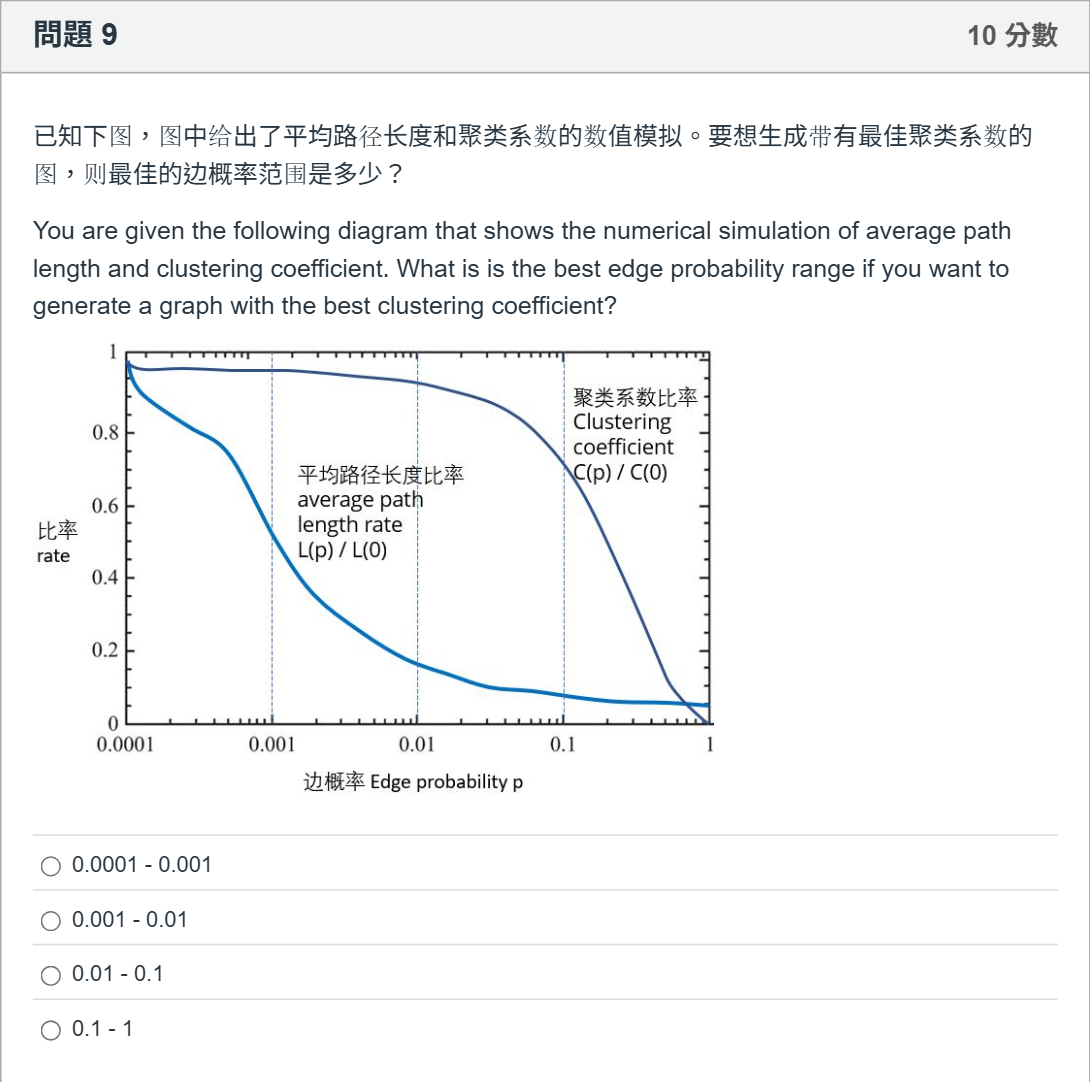
已知下图,图中给出了平均路径长度和聚类系数的数值模拟。要想生成带有最佳聚类系数的图,则最佳的边概率范围是多少? You are given the following diagram that shows the numerical simulation of average path length and clustering coefficient. What is is the best edge probability range if you want to generate a graph with the best clustering coefficient?单项选择题
A
0.0001 - 0.001
B
0.001 - 0.01
C
0.01 - 0.1
D
0.1 - 1
登录即可查看完整答案
我们收录了全球超50000道真实原题与详细解析,现在登录,立即获得答案。
类似问题
当生成一个包含 n 个节点的随机图时,我们开始通过随机选择节点对来添加边。当我们添加边时,最大连通子图(组件)的直径会不断增长,直到平均节点度 c= When generating a random graph with n nodes, we start adding edges by randomly selecting pairs of nodes. As we adding the edges, the diameter of the largest connected subgraph (component) grows till the average node degree c =
在随机图 G(n, p) 中,边的数量的期望值是 m = In a random graph G(n, p), the expected number of edge m =
For stock A, we have 𝛽 𝑖 = 0.70. Suppose the expected market risk premium next year is 9% and the risk-free rate is 3%. What is the expected return of this stock based on the CAPM? (Please answer in % and round to 2 decimal places. If the answer is 8.057%, then in the box, write 8.06)
Suppose a multifactor model has three factor risk premia: market = 6%, profitability = 3%, and investment = 2%. A stock has: 𝛽 𝑚 𝑎 𝑟 𝑘 𝑒 𝑡 = 1.1, 𝛽 𝑝 𝑟 𝑜 𝑓 𝑖 𝑡 𝑎 𝑏 𝑖 𝑙 𝑖 𝑡 𝑦 = 0.5, 𝛽 𝑖 𝑛 𝑣 𝑒 𝑠 𝑡 𝑚 𝑒 𝑛 𝑡 = -0.2, And the risk-free rate is 3%. What is the expected return? (Please answer in % and round to 2 decimal places. If the answer is 8.057%, then in the box, write 8.06)
更多留学生实用工具
希望你的学习变得更简单
加入我们,立即解锁 海量真题 与 独家解析,让复习快人一步!