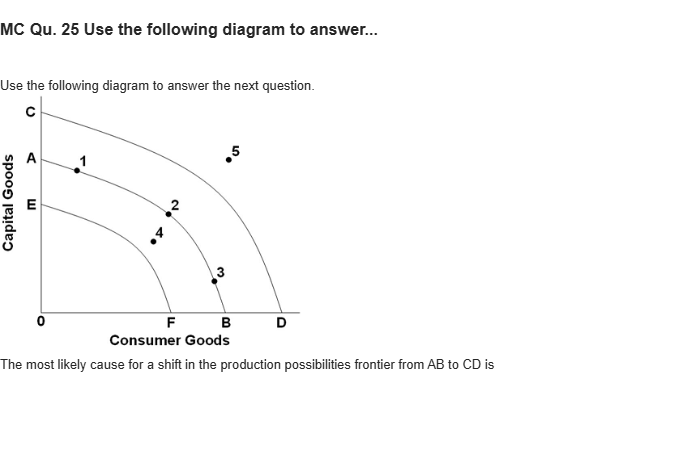
MC Qu. 25 Use the following diagram to answer... Use the following diagram to answer the next question. The horizontal axis is labeled consumer goods and lists markings from left to right as F, B, and D. The vertical axis is labeled capital goods and lists markings from bottom to top as E, A, and C. Three concentric curves are drawn from the vertical axis to the horizontal axis and the curves' overall shape is a quarter circle, approximately. First curve initiates from E and ends at F, second curve initiates from A and ends at B, and the third curve initiates from C and ends at D at the horizontal axis. Second curve has three points labeled as 1, 2, and 3. A point labeled 4 is plotted to the left of point 2 (between first and second curve). A point labeled 5 is plotted to the right of point 2 (after the third curve). The most likely cause for a shift in the production possibilities frontier from AB to CD is单项选择题
A
an increase in government purchase of the economy's output.
B
an increase in the spending of business and consumers.
C
the use of the economy's resources in a less efficient way.
D
an increase in the quantity and quality of labor resources.
登录即可查看完整答案
我们收录了全球超50000道真实原题与详细解析,现在登录,立即获得答案。
类似问题
Given the production possibilities curve above, which of the following represents a movement from efficiency to inefficiency?
Refer to the production possibility curve for Marketopia below. The graph indicates that with the resources and technology it has available, Marketopia
Using the PPF graph below identify the points that are attainable with current resources.
Refer to the following graph to answer the next question. In the graph, Point C is a(n) _________ point.
更多留学生实用工具
希望你的学习变得更简单
加入我们,立即解锁 海量真题 与 独家解析,让复习快人一步!