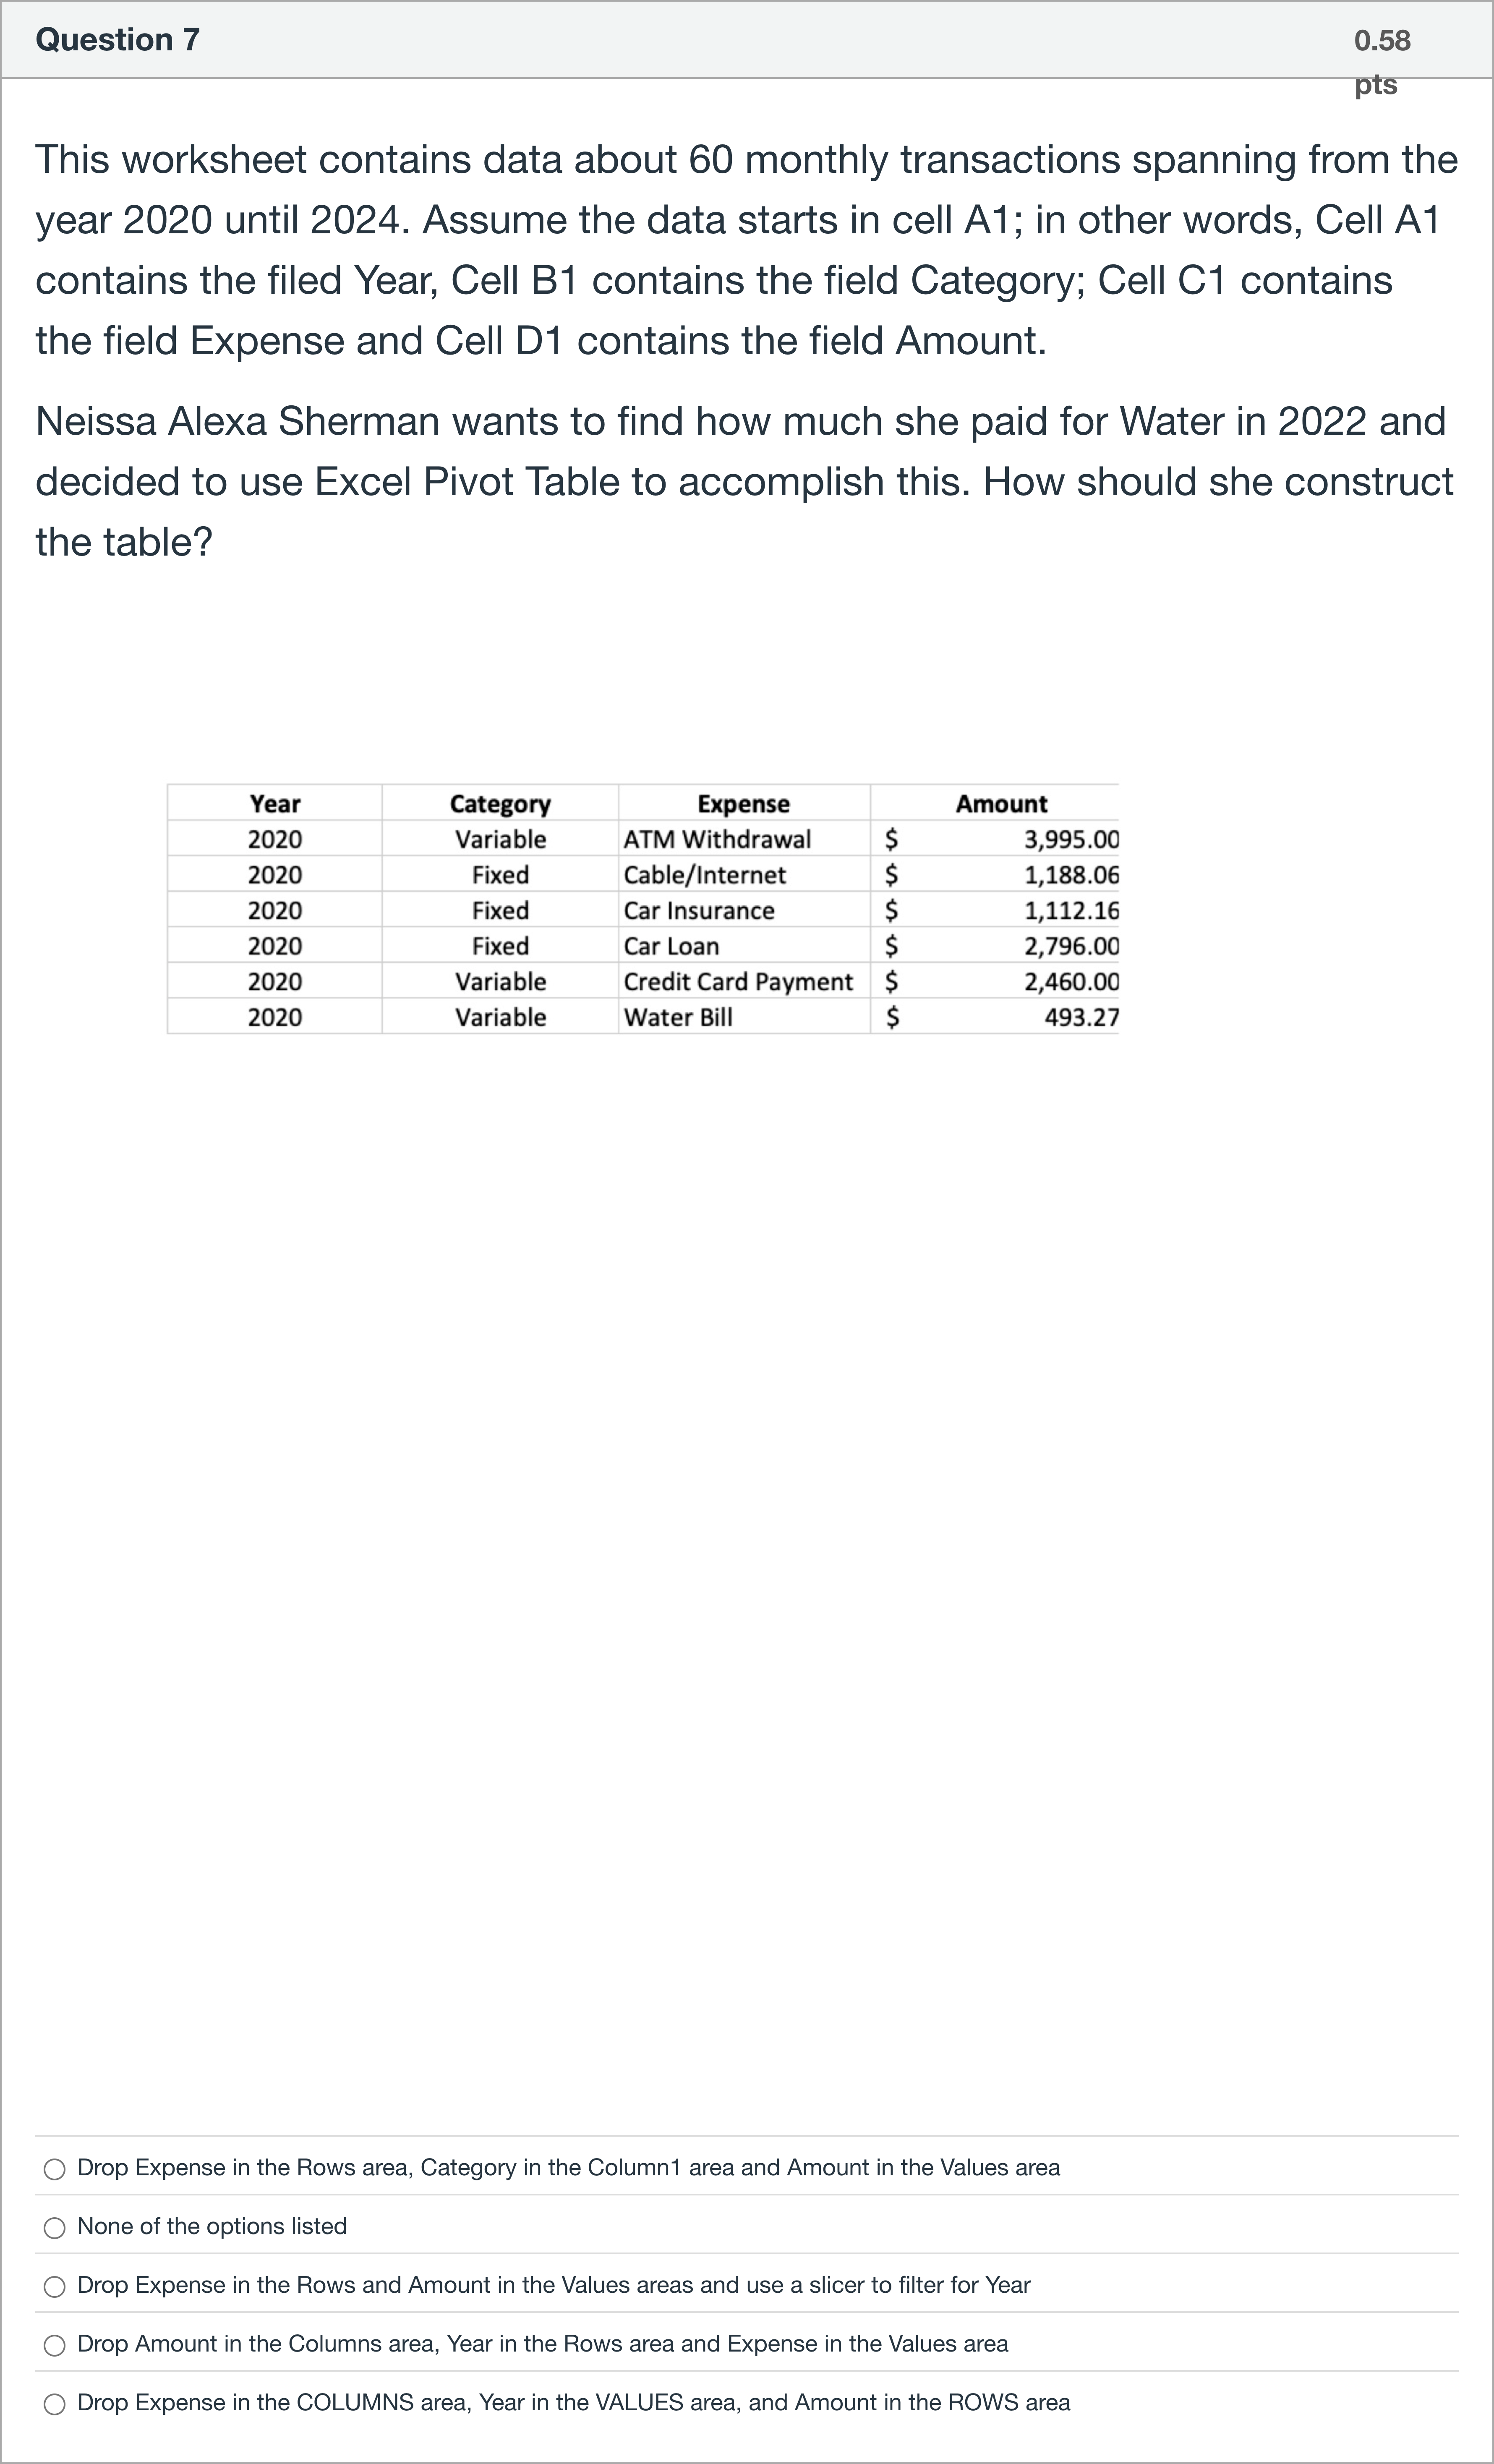
This worksheet contains data about 60 monthly transactions spanning from the year 2020 until 2024. Assume the data starts in cell A1; in other words, Cell A1 contains the filed Year, Cell B1 contains the field Category; Cell C1 contains the field Expense and Cell D1 contains the field Amount. Neissa Alexa Sherman wants to find how much she paid for Water in 2022 and decided to use Excel Pivot Table to accomplish this. How should she construct the table? 单项选择题
A
Drop Expense in the Rows area, Category in the Column1 area and Amount in the Values area
B
None of the options listed
C
Drop Expense in the Rows and Amount in the Values areas and use a slicer to filter for Year
D
Drop Amount in the Columns area, Year in the Rows area and Expense in the Values area
E
Drop Expense in the COLUMNS area, Year in the VALUES area, and Amount in the ROWS area
登录即可查看完整答案
我们收录了全球超50000道真实原题与详细解析,现在登录,立即获得答案。
类似问题
Imagine I have the data below and I want to create a pivot table that shows the average of Average Income by year. Would the following panels retrieve the correct table?
A portion of an Excel Worksheet is given below: You wish to create a pivot table displaying the following information. How would you complete the pivot table design below? Match the Pivot Table Fields to the correct drag areas. 1: FILTERS 2: ROWS 3: COLUMNS 4: VALUES
A(n) ________ table is a spreadsheet feature that displays two or more dimensions of data in a convenient format.
3. The speaker seems most disappointed about:
更多留学生实用工具
希望你的学习变得更简单
加入我们,立即解锁 海量真题 与 独家解析,让复习快人一步!