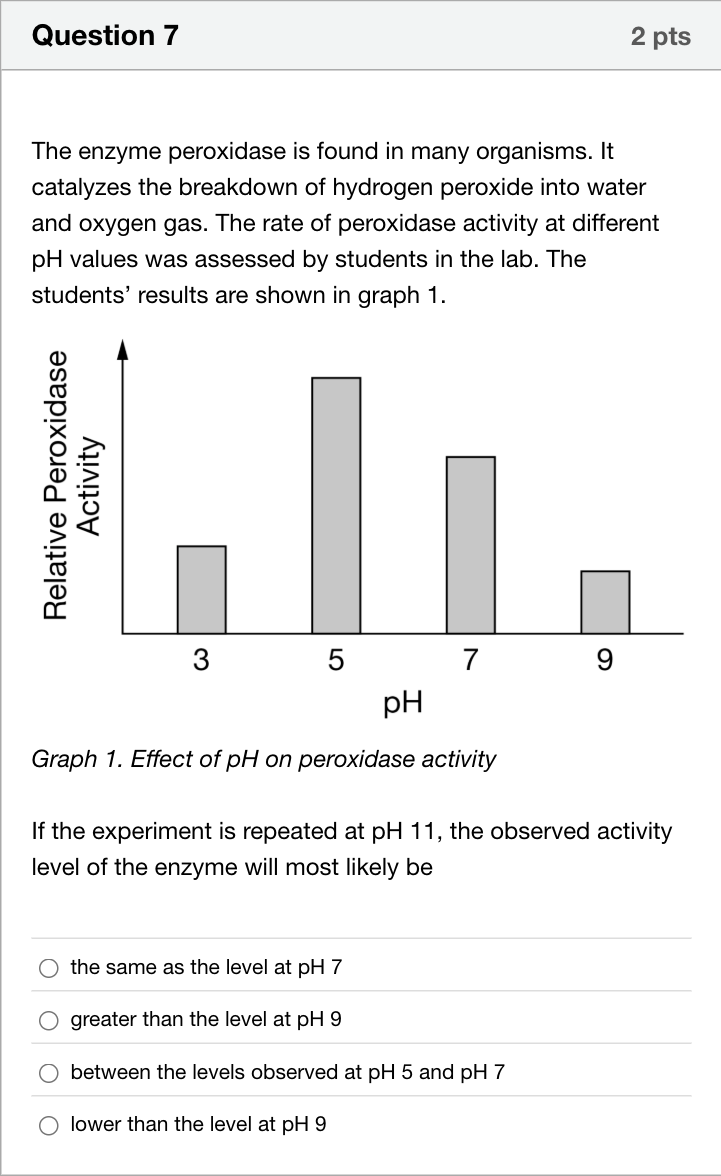
The enzyme peroxidase is found in many organisms. It catalyzes the breakdown of hydrogen peroxide into water and oxygen gas. The rate of peroxidase activity at different pH values was assessed by students in the lab. The students’ results are shown in graph 1. Graph 1. Effect of pH on peroxidase activity The figure presents a bar graph with 4 bars. The horizontal axis is labeled p H, and the four bars are labeled 3, 5, 7, and 9. The vertical axis is labeled Relative Peroxidase Activity, and no numbers are indicated along it, but an arrowhead is present at the top of the axis. The relative heights of each bar, with respect to the vertical axis, are approximately as follows. The bar for p H 3 reaches a height equivalent to one third of the vertical axis. The bar for p H 5 reaches the top of the vertical axis. The bar for p H 7 reaches a height equivalent to two thirds of the vertical axis. The bar for p H 9 reaches a height equivalent to one quarter of the vertical axis. If the experiment is repeated at pH 11, the observed activity level of the enzyme will most likely be单项选择题
A
the same as the level at pH 7
B
greater than the level at pH 9
C
between the levels observed at pH 5 and pH 7
D
lower than the level at pH 9
登录即可查看完整答案
我们收录了全球超50000道真实原题与详细解析,现在登录,立即获得答案。
类似问题
Graphs I-IV depict the effect of pH on the activity of four different hydrolytic enzymes. Graph I has an x-axis labeled pH showing pH six to ten in increments of 2, and a y-axis labeled relative activity. The curve is a bell curve with a peak at pH 7. Graph II has an x-axis labeled pH showing pH six to ten in increments of 2, and a y-axis labeled relative activity. The curve increases exponentially then levels out at pH 7. Graph III has an x-axis labeled pH showing pH two to six in increments of 2, and a y-axis labeled relative activity. The curve is the second half of a bell curve, starting just before the peak, with a peak at pH 2. Graph IV has an x-axis labeled pH showing pH four to eight in increments of 2, and a y-axis labeled relative activity. The curve is a slope of zero high on the y-axis, from pH 4 to after pH 8. Enzymes with their highest activity at an alkaline (basic) pH are represented by which of the following graphs?
Is the following statement true or false? In the products of methylation-hydrolysis, every -OH group corresponds to the position of a glycosidic bond in the starting polysaccharide.
Which of the follwoing structures represents amylopectin?
Which of the following is true about an aldopentose?I. It is a monosaccharide.II. It contains a CHO groupIII. It is a disaccharide.IV. It is an oligosaccharide.
更多留学生实用工具
希望你的学习变得更简单
加入我们,立即解锁 海量真题 与 独家解析,让复习快人一步!