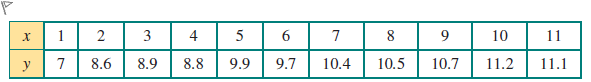
The following data were collected for two related variables x and y. A scatterplot indicates a non-linear association. The data is linearised using a logx transformation and a least squares line is then fitted. The equation of this line isclosest to:单项选择题
A
a. y = −1.71 + 0.25 log x
B
b. y = 7.04 + 3.86 log x
C
c. y = 7.52 + 0.37 log x
D
d. y = 0.37 + 7.52 log x
登录即可查看完整答案
我们收录了全球超50000道真实原题与详细解析,现在登录,立即获得答案。
类似问题
The association between two variables y and x, asshown in the scatterplot above, is non-linear. In an attempt totransform the relationship to linearity, a student wouldbe advised to:
The association between two variables y and x, as shown in the scatterplot above, is non-linear. Which of the following transformations is most likely to linearise the relationship?
The following data were collected for two related variables x and y. A scatterplot indicates a non-linear association. The data is linearised using a logx transformation and a least squares line is then fitted. The equation of this line isclosest to:
Which transformation is commonly used to reduce right-skewed distributions?
更多留学生实用工具
希望你的学习变得更简单
加入我们,立即解锁 海量真题 与 独家解析,让复习快人一步!