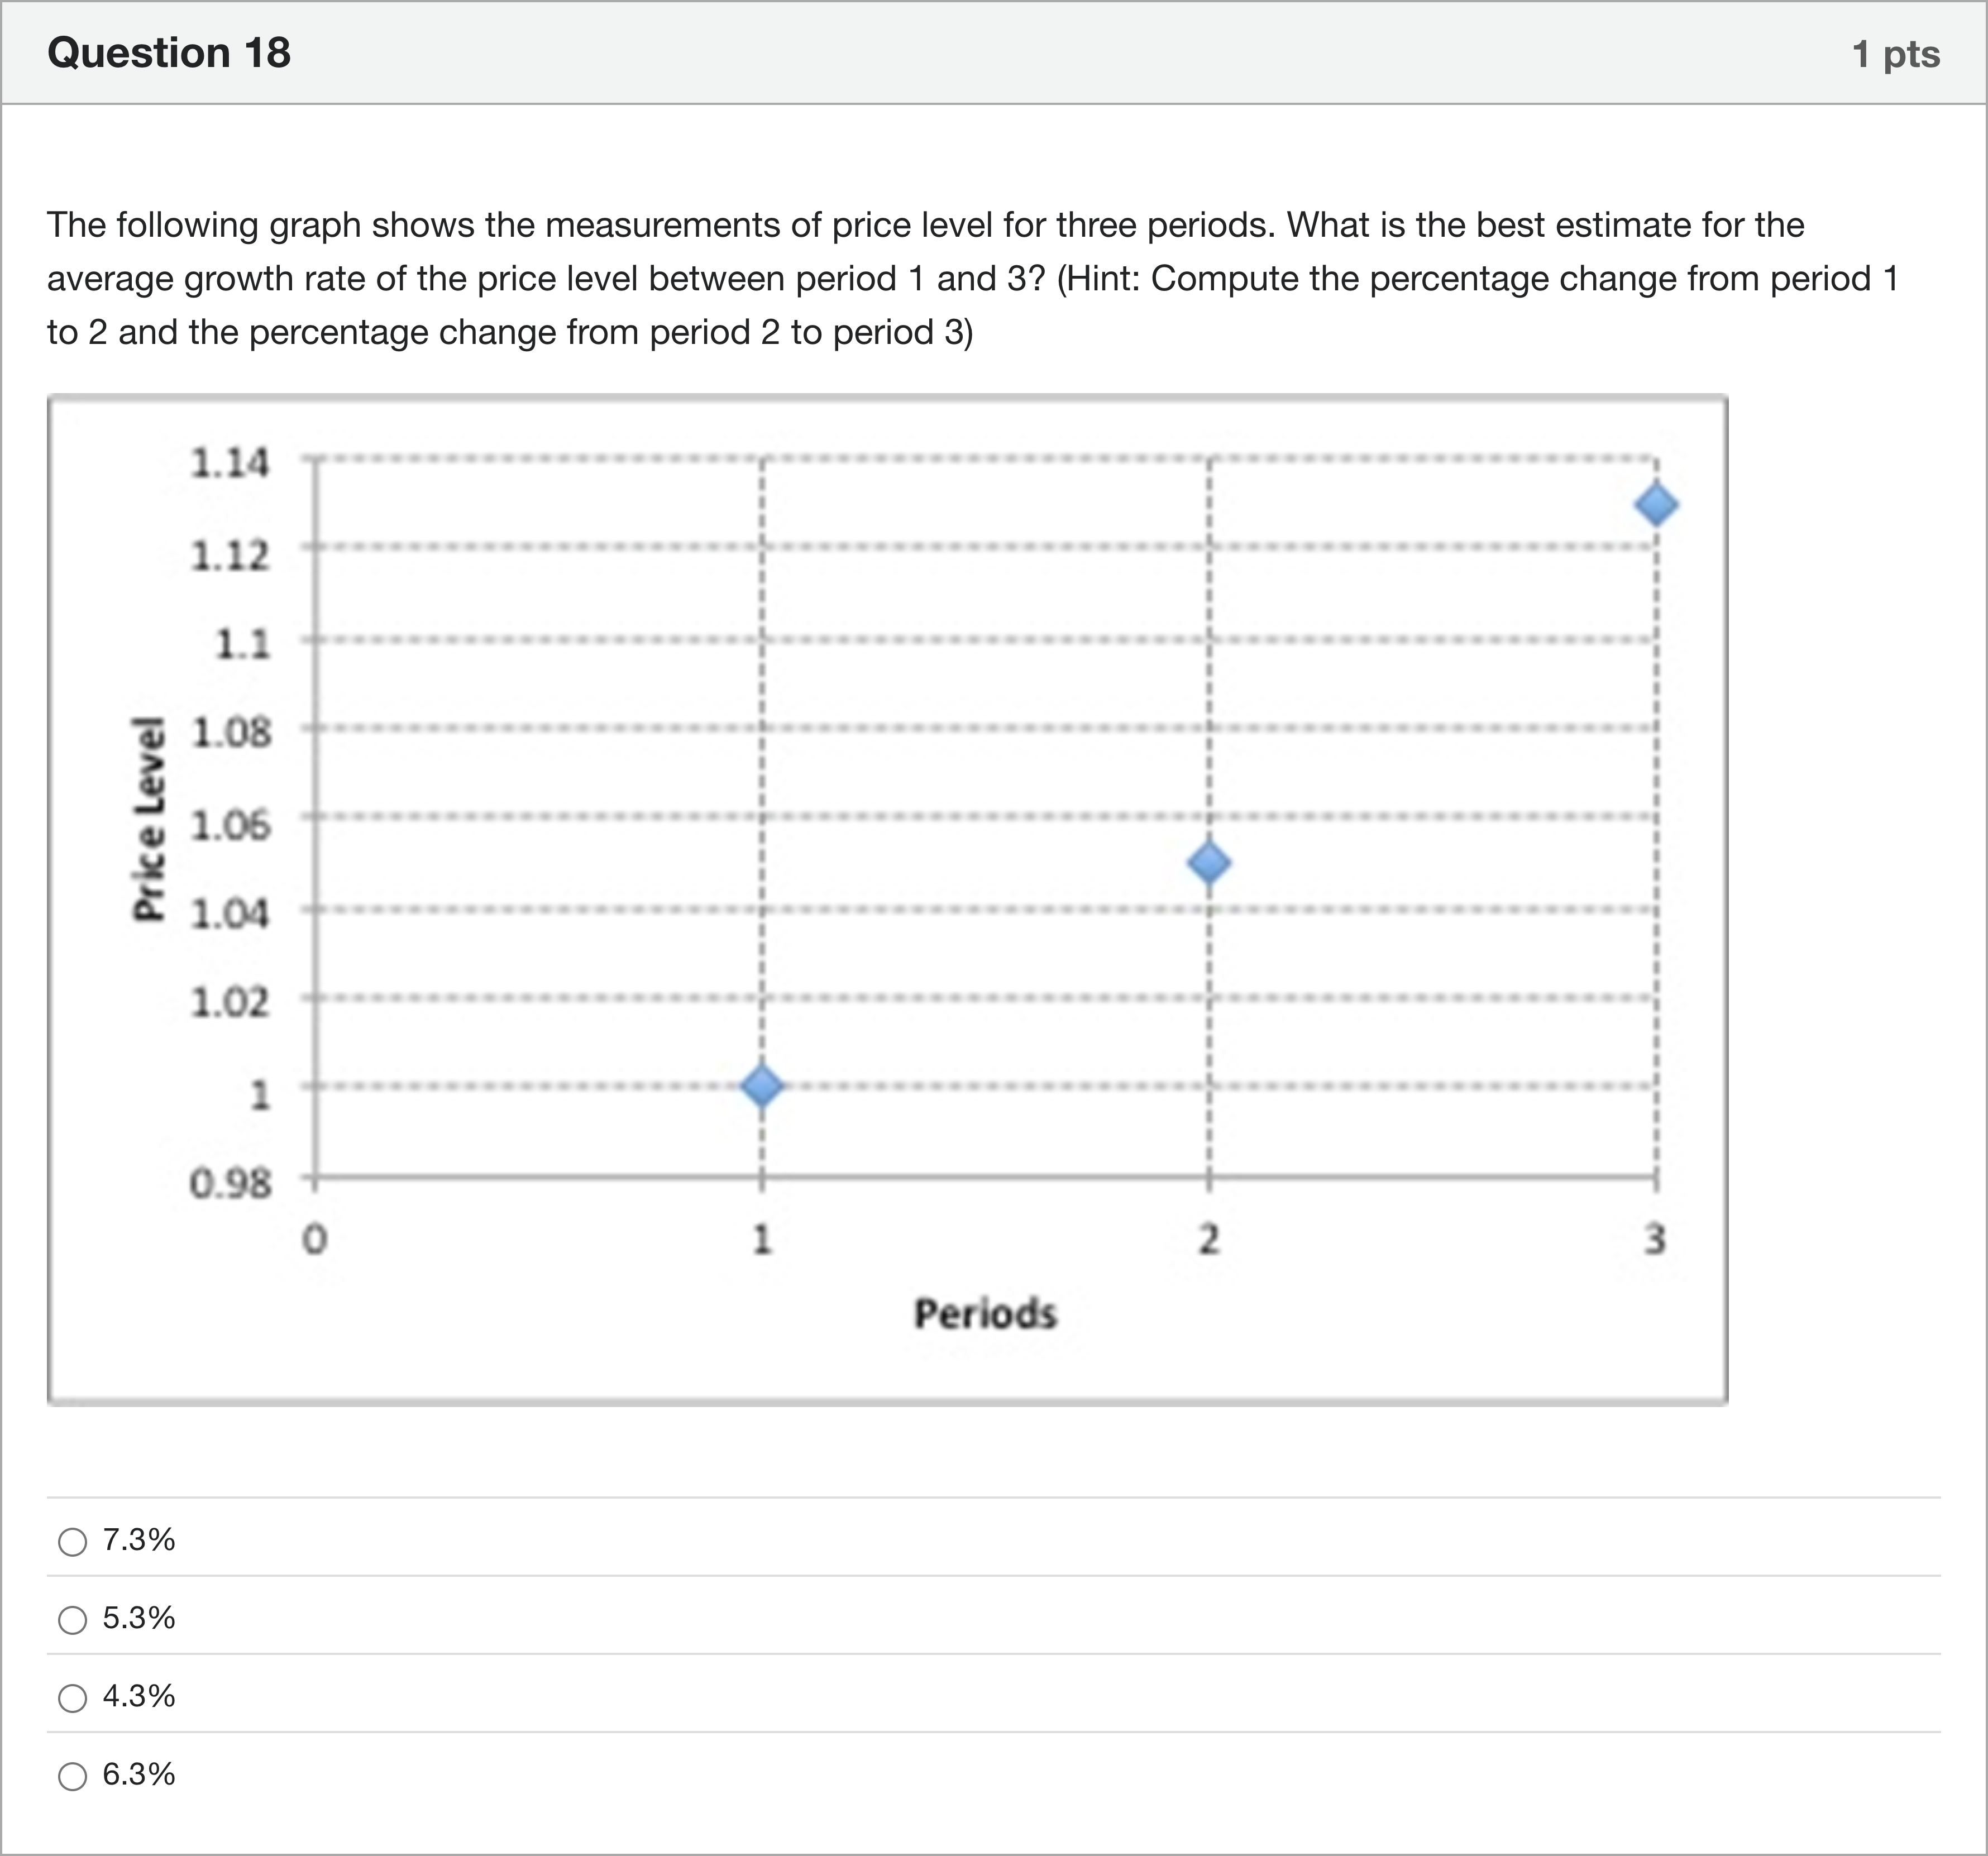
The following graph shows the measurements of price level for three periods. What is the best estimate for the average growth rate of the price level between period 1 and 3? (Hint: Compute the percentage change from period 1 to 2 and the percentage change from period 2 to period 3)单项选择题
A
7.3%
B
5.3%
C
4.3%
D
6.3%
登录即可查看完整答案
我们收录了全球超50000道真实原题与详细解析,现在登录,立即获得答案。
类似问题
If the Consumer Price Index (CPI) falls from 100 to 98 between two consecutive years, this implies that prices fell by 2% between those two years.
Table 24-1 The following table pertains to Cheeseland, an economy in which the typical consumer's basket consists of 15 bushels of apples and 8 bushels of almond . Year Price of Apples (Dollars per bushel) Price of Almond (Dollars per bushel) Year 1 12 6 Year 2 9 11 Refer to Table 24-1. If Year 1 is the base year, then the inflation rate in Year 2 was
If Year 1 is the base year and Year 2 is the following year, then the inflation rate in Year 2 equals
Table 23-4 The country of Caspir produces only cereal and milk. Quantities and prices of these goods for the last several years are shown in the following table. The base year is 2015. Year Cereal Milk Price (Dollars per box) Quantity (Boxes of cereal) Price (Dollars per gallon) Quantity (Gallons) 2015 4.00 100 1.50 180 2016 4.00 120 2.00 200 2017 5.00 150 2.50 200 2018 6.00 180 3.50 240 Refer to Table 23-4. This country's inflation rate from 2016 to 2017 was
更多留学生实用工具
希望你的学习变得更简单
加入我们,立即解锁 海量真题 与 独家解析,让复习快人一步!