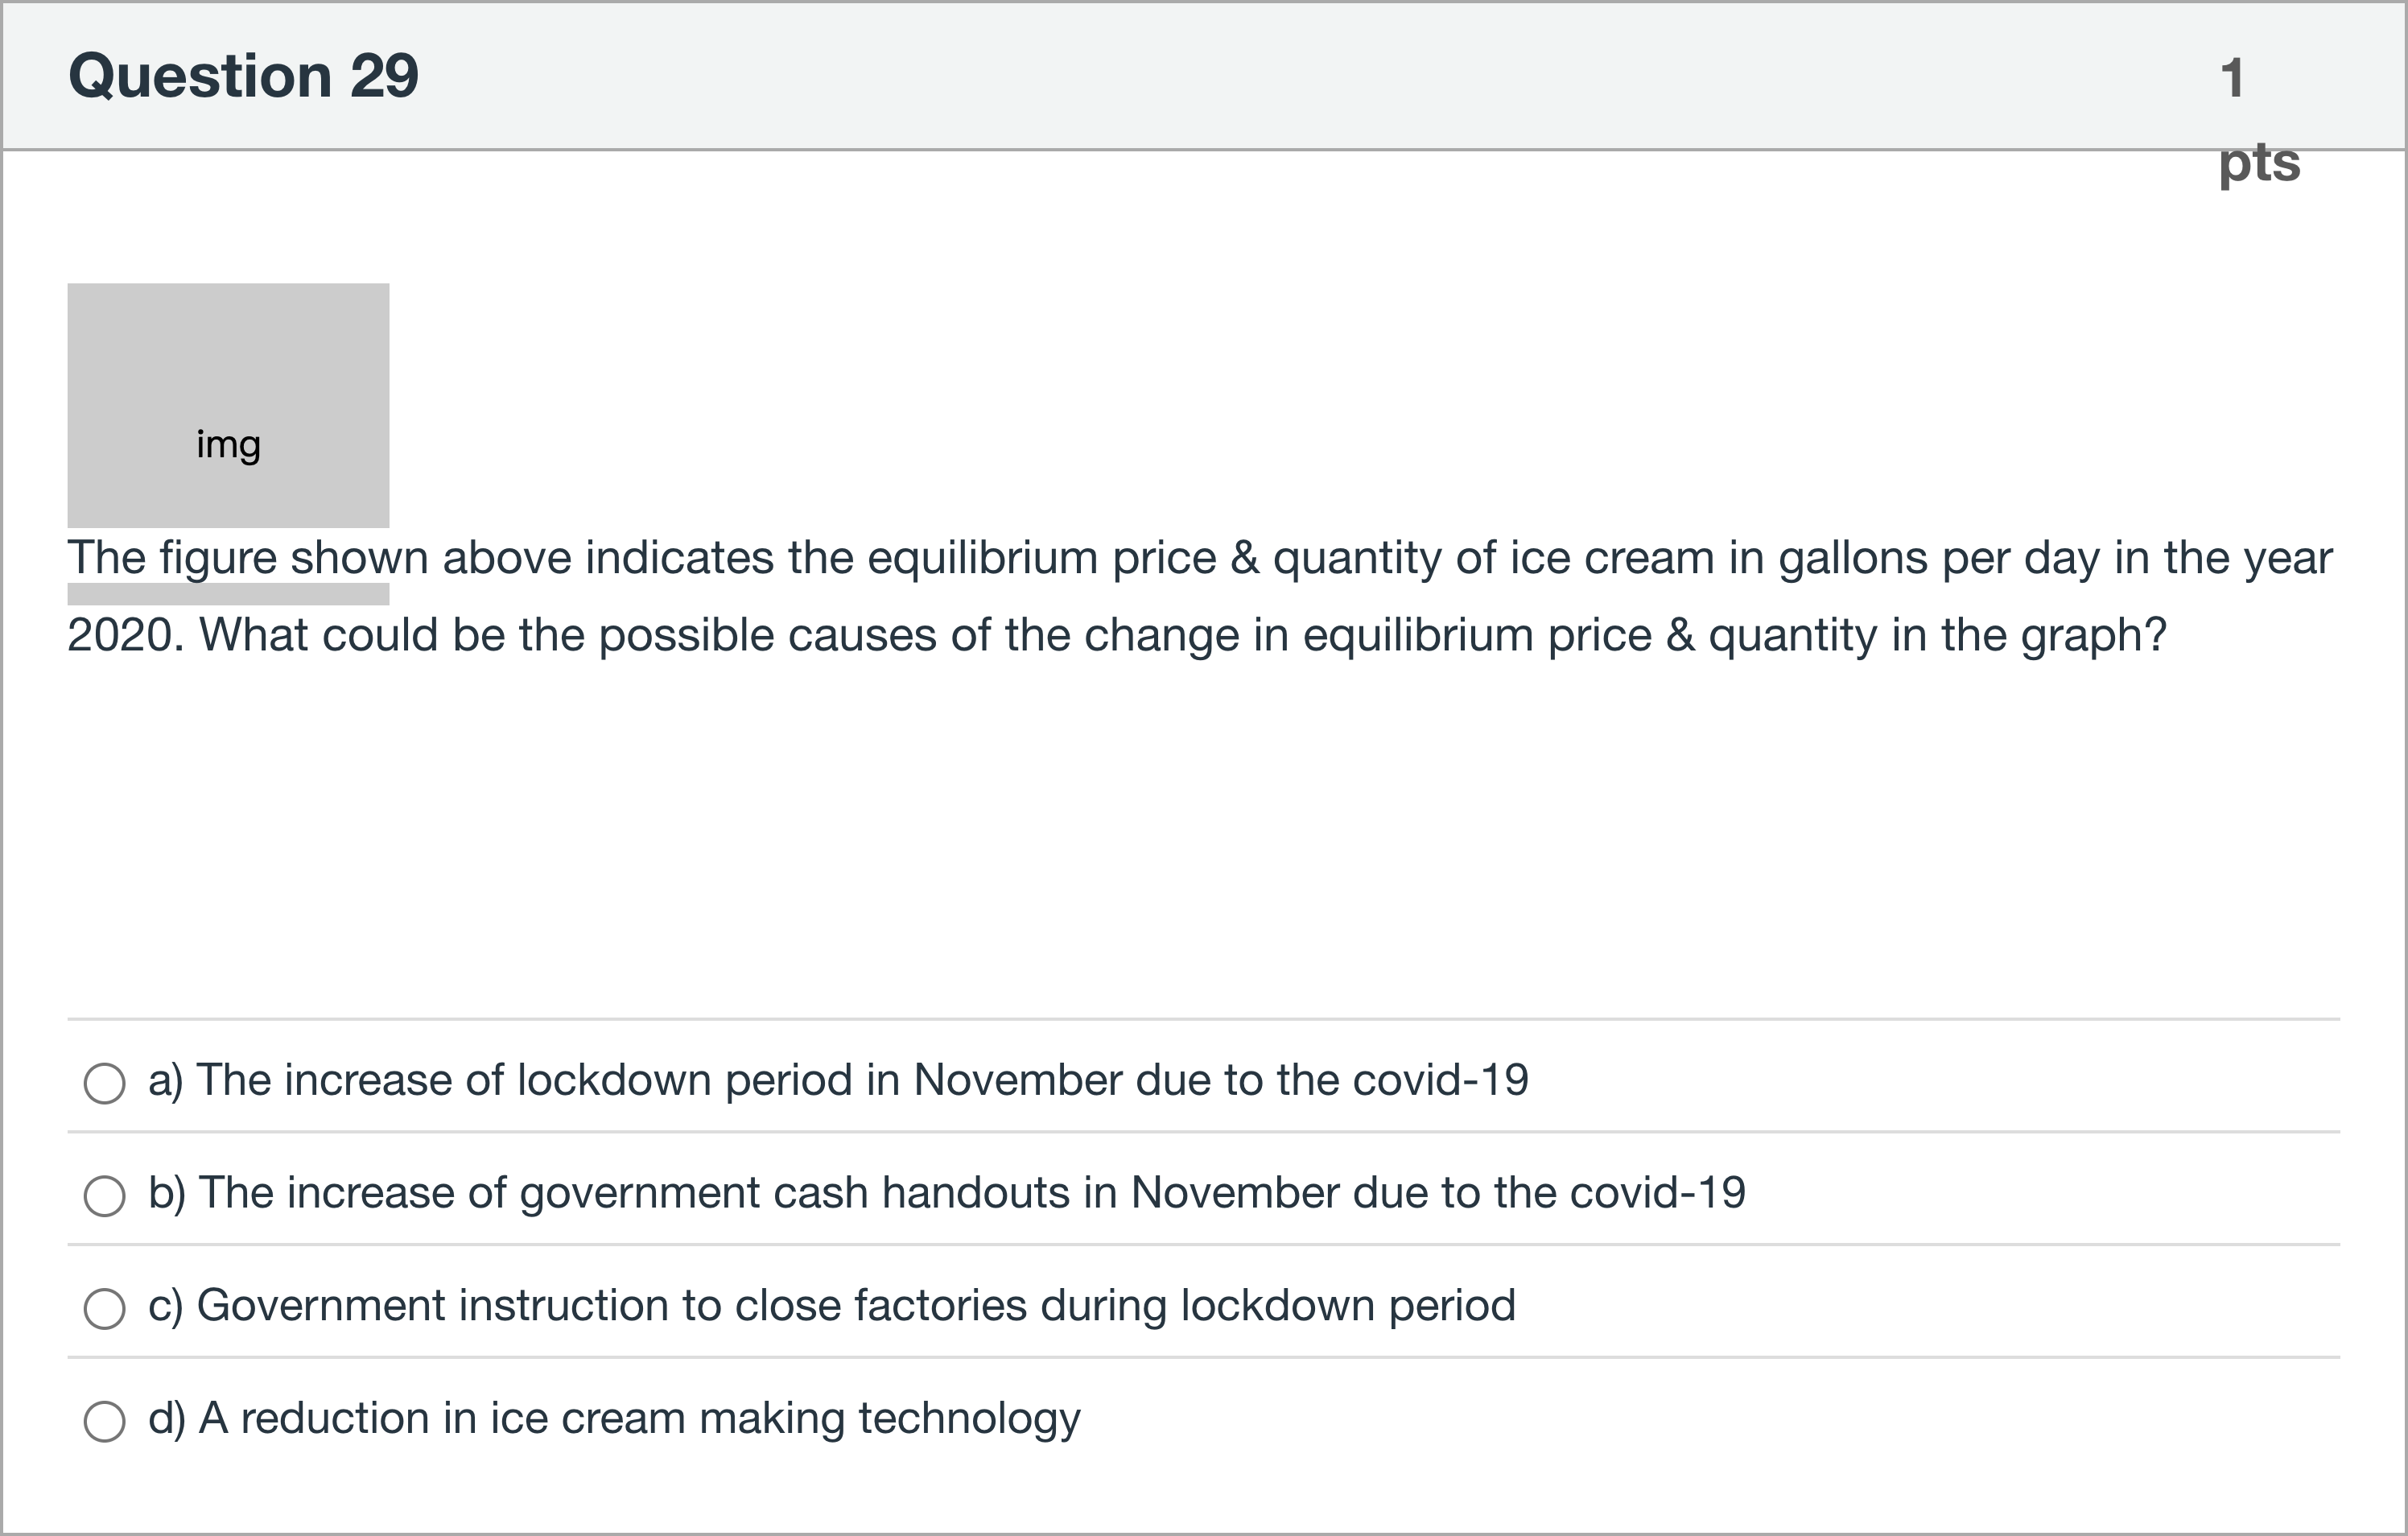
The figure shown above indicates the equilibrium price & quantity of ice cream in gallons per day in the year 2020. What could be the possible causes of the change in equilibrium price & quantity in the graph? 单项选择题
A
a) The increase of lockdown period in November due to the covid-19
B
b) The increase of government cash handouts in November due to the covid-19
C
c) Government instruction to close factories during lockdown period
D
d) A reduction in ice cream making technology
登录即可查看完整答案
我们收录了全球超50000道真实原题与详细解析,现在登录,立即获得答案。
类似问题
Imagine the government imposes an excise tax on sellers of soft drinks containing more than 10% sugar. Which effect is most likely in the market for soft drinks?
Imagine inflation in Australia is rising at a much faster rate than in China, making Chinese products relatively cheaper for Australians and other foreigners. Which of the following effects is likely?
Assume Indonesia and Australia are major trading partners. If Indonesian incomes rise relative to Australia's, ceteris paribus, we should expect
1. The name of this course is _______________________________. Introduction to Social Data Analytics Principles of Macroeconomics. Principles of Microeconomics. Econometrics A. I have no idea why I am even in this class.
更多留学生实用工具
希望你的学习变得更简单
加入我们,立即解锁 海量真题 与 独家解析,让复习快人一步!