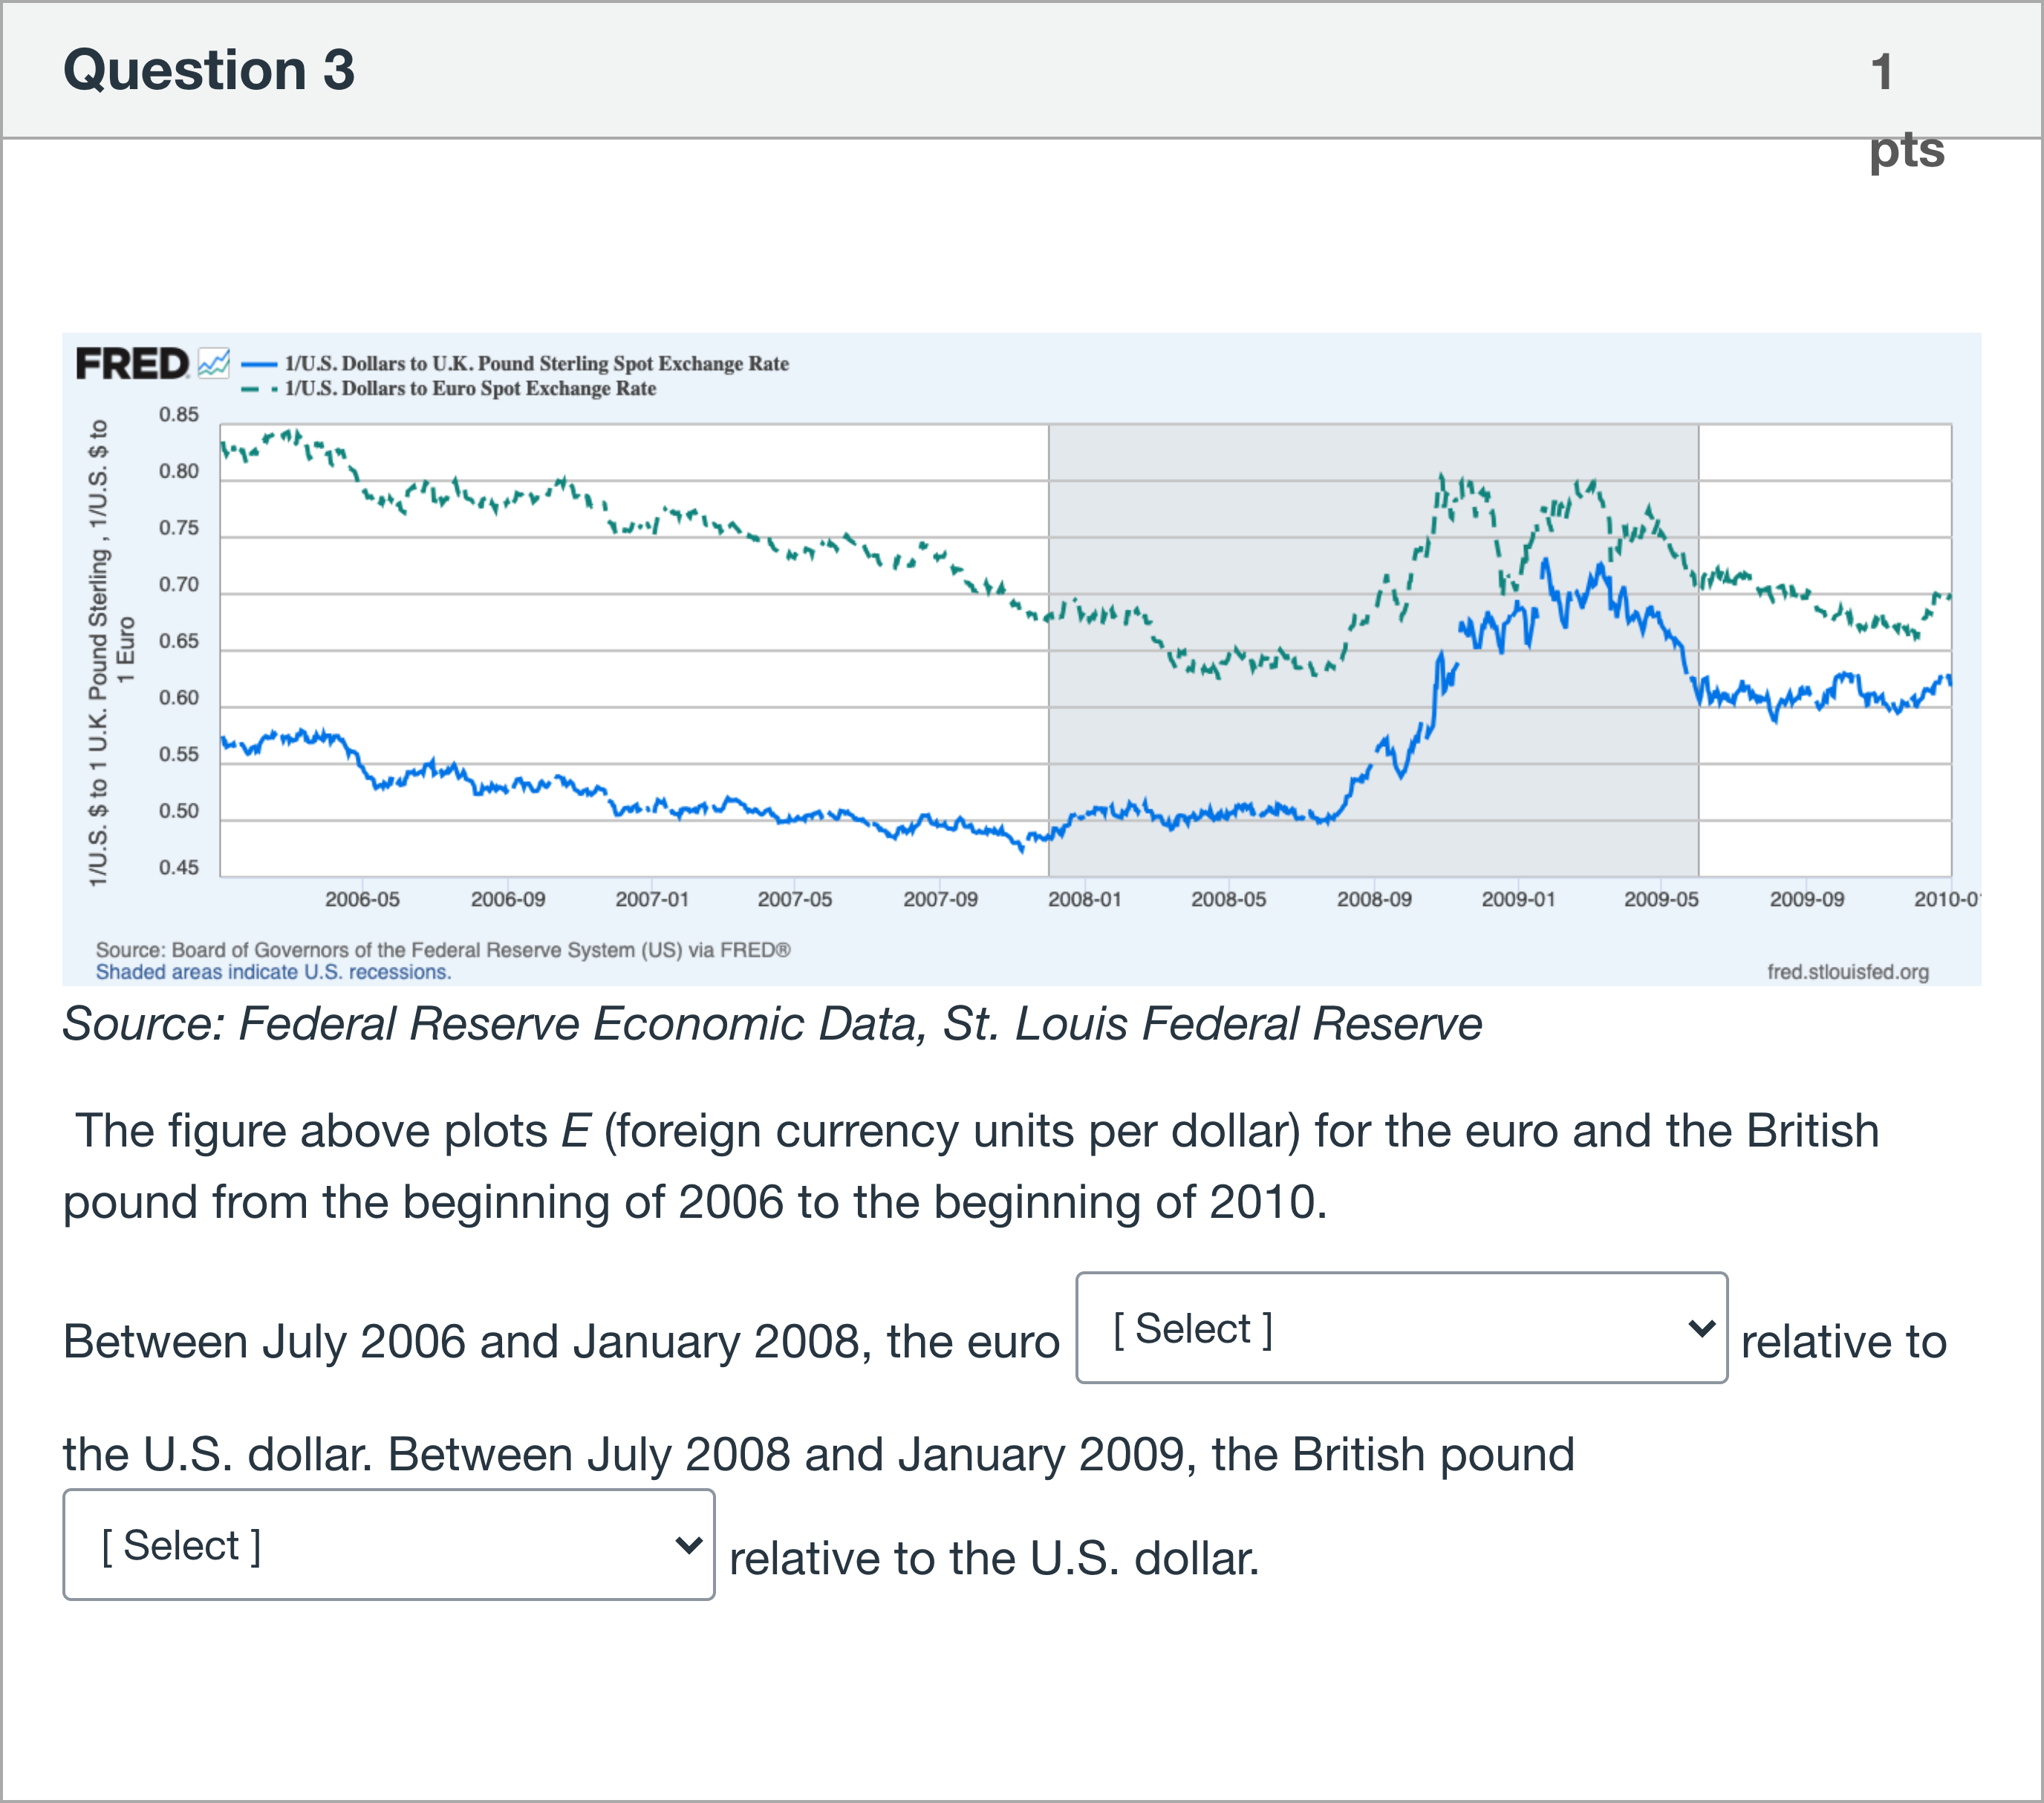
Source: Federal Reserve Economic Data, St. Louis Federal Reserve The figure above plots E (foreign currency units per dollar) for the euro and the British pound from the beginning of 2006 to the beginning of 2010. Between July 2006 and January 2008, the euro [ Select ] appreciated stayed roughly constant depreciated relative to the U.S. dollar. Between July 2008 and January 2009, the British pound [ Select ] appreciated stayed roughly constant depreciated relative to the U.S. dollar.多重下拉选择题
登录即可查看完整答案
我们收录了全球超50000道真实原题与详细解析,现在登录,立即获得答案。
类似问题
Which of the following events may result in the Appreciation of AUD against the U.S.dollar?
If the Australian dollar depreciates against the US dollar, holding other factors constant, which one of the followings may likely happen?
In November 2020, the price level in the U.S. was 𝑃 𝑈 𝑆 = 120 . At the same date, the price level in the Eurozone was 𝑃 𝐸 𝑈 = 105 . One year later, the price levels were 𝑃 𝑈 𝑆 = 125 and 𝑃 𝐸 𝑈 = 108 . During this 12-month period, the real exchange rate was constant. The nominal exchange rate (E) is reported in euros per dollar (i.e., how many euros do we need to purchase one dollar). Using the information above, calculate the rate of change of E during this time (in percent). Round your answer to the nearest tenth of a percent.
In November 2020, the price level in the U.S. was 𝑃 𝑈 𝑆 = 132 . At the same date, the price level in the Eurozone was 𝑃 𝐸 𝑈 = 98 . One year later, the price levels were 𝑃 𝑈 𝑆 = 128 and 𝑃 𝐸 𝑈 = 102 . During this 12-month period, the real exchange rate was constant. The nominal exchange rate (E) is reported in euros per dollar (i.e., how many euros do we need to purchase one dollar). Using the information above, calculate the rate of change of E during this time (in percent). Round your answer to the nearest tenth of a percent.
更多留学生实用工具
希望你的学习变得更简单
加入我们,立即解锁 海量真题 与 独家解析,让复习快人一步!