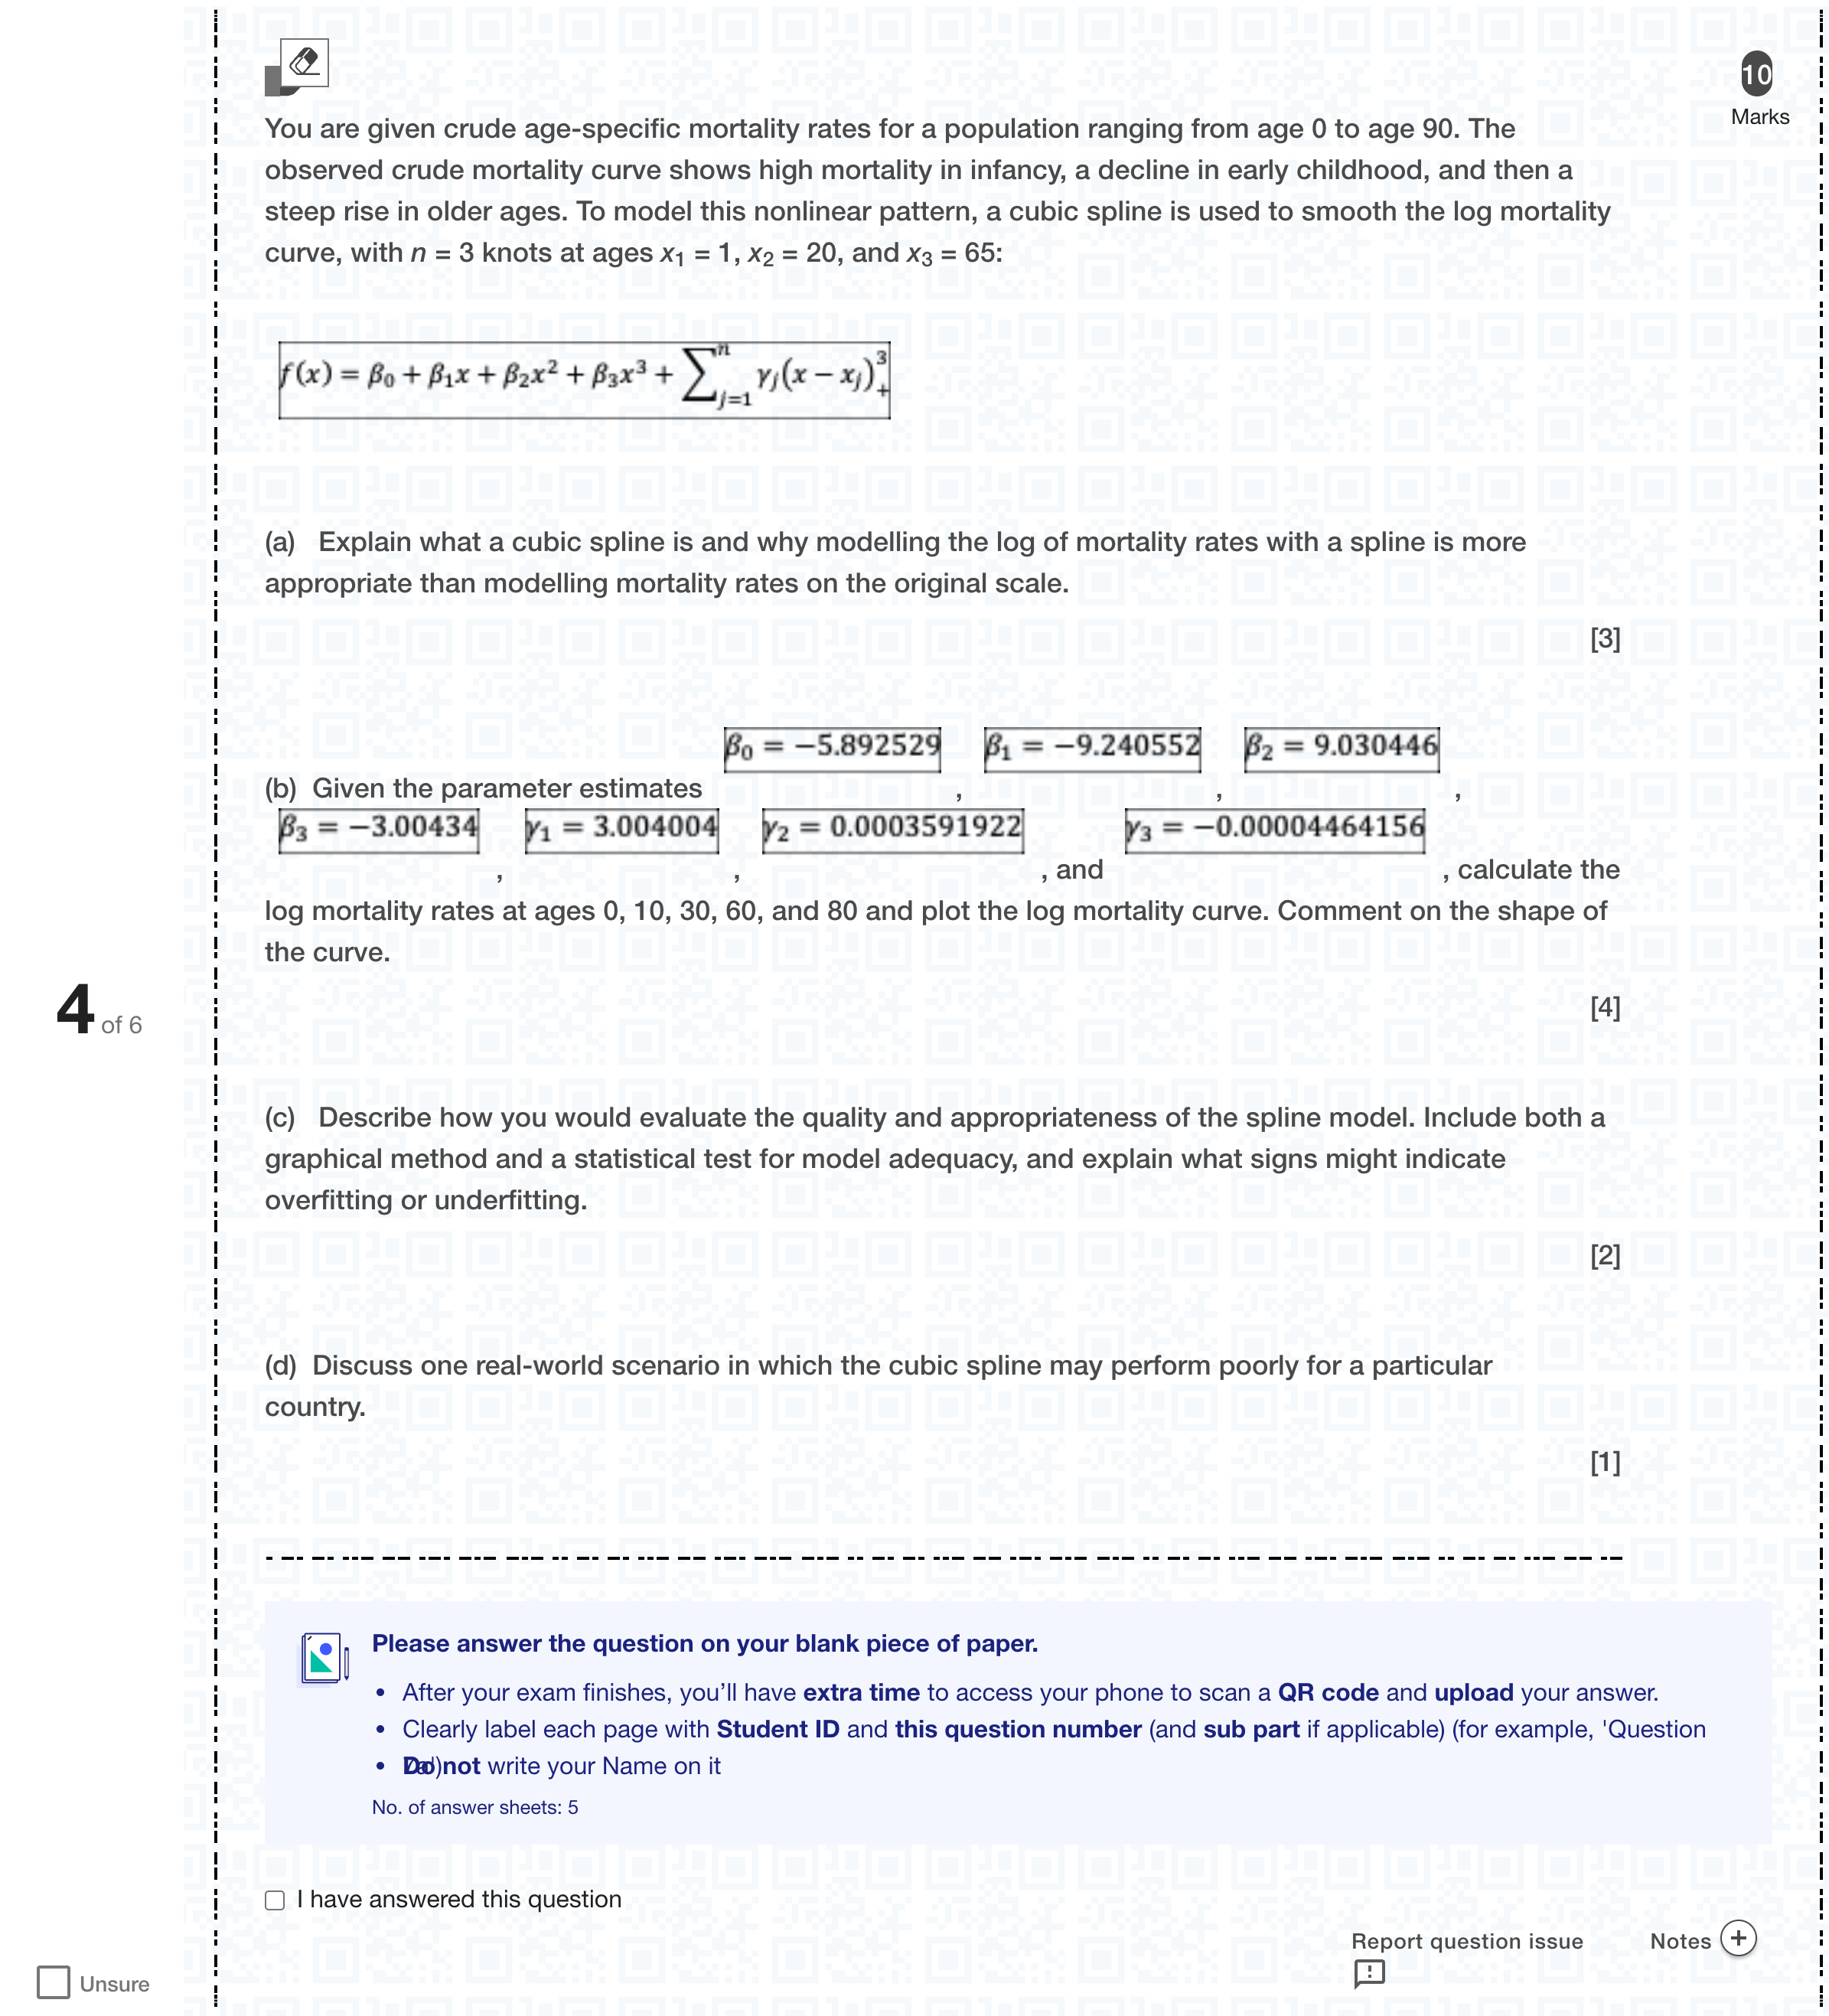
You are given crude age-specific mortality rates for a population ranging from age 0 to age 90. The observed crude mortality curve shows high mortality in infancy, a decline in early childhood, and then a steep rise in older ages. To model this nonlinear pattern, a cubic spline is used to smooth the log mortality curve, with n = 3 knots at ages x1 = 1, x2 = 20, and x3 = 65: (a) Explain what a cubic spline is and why modelling the log of mortality rates with a spline is more appropriate than modelling mortality rates on the original scale. [3] (b) Given the parameter estimates , , , , , , and , calculate the log mortality rates at ages 0, 10, 30, 60, and 80 and plot the log mortality curve. Comment on the shape of the curve.[4] (c) Describe how you would evaluate the quality and appropriateness of the spline model. Include both a graphical method and a statistical test for model adequacy, and explain what signs might indicate overfitting or underfitting. [2] (d) Discuss one real-world scenario in which the cubic spline may perform poorly for a particular country. [1][Fill in the blank]多项填空题
登录即可查看完整答案
我们收录了全球超50000道真实原题与详细解析,现在登录,立即获得答案。
类似问题
One explanation for the U-shaped average variable cost curve is that greater Blank ______ yields more efficiency and variable cost per unit of output declines
An increase in the price of labor has no effect on which cost curve?
A firm's insurance premiums are generally considered costs.
A researcher is analysing the time until job loss for a sample of workers. The following Cox proportional hazards model has been estimated: where • Training = 1 if participated in job training, 0 otherwise • Age = age of worker • Union = 1 if union member, 0 otherwise (a) Explain the structure of this Cox proportional hazards model. What does the baseline hazard represent, and what does the proportional hazards assumption imply? [2] (b) Describe the partial likelihood estimation method for estimating the coefficients here. [4] (c) Calculate the hazard ratio for the following two individuals and interpret the result. Individual A: Age = 40, Training = 1, Union = 0 Individual B: Age = 40, Training = 0, Union = 0 [4][Fill in the blank]
更多留学生实用工具
希望你的学习变得更简单
加入我们,立即解锁 海量真题 与 独家解析,让复习快人一步!