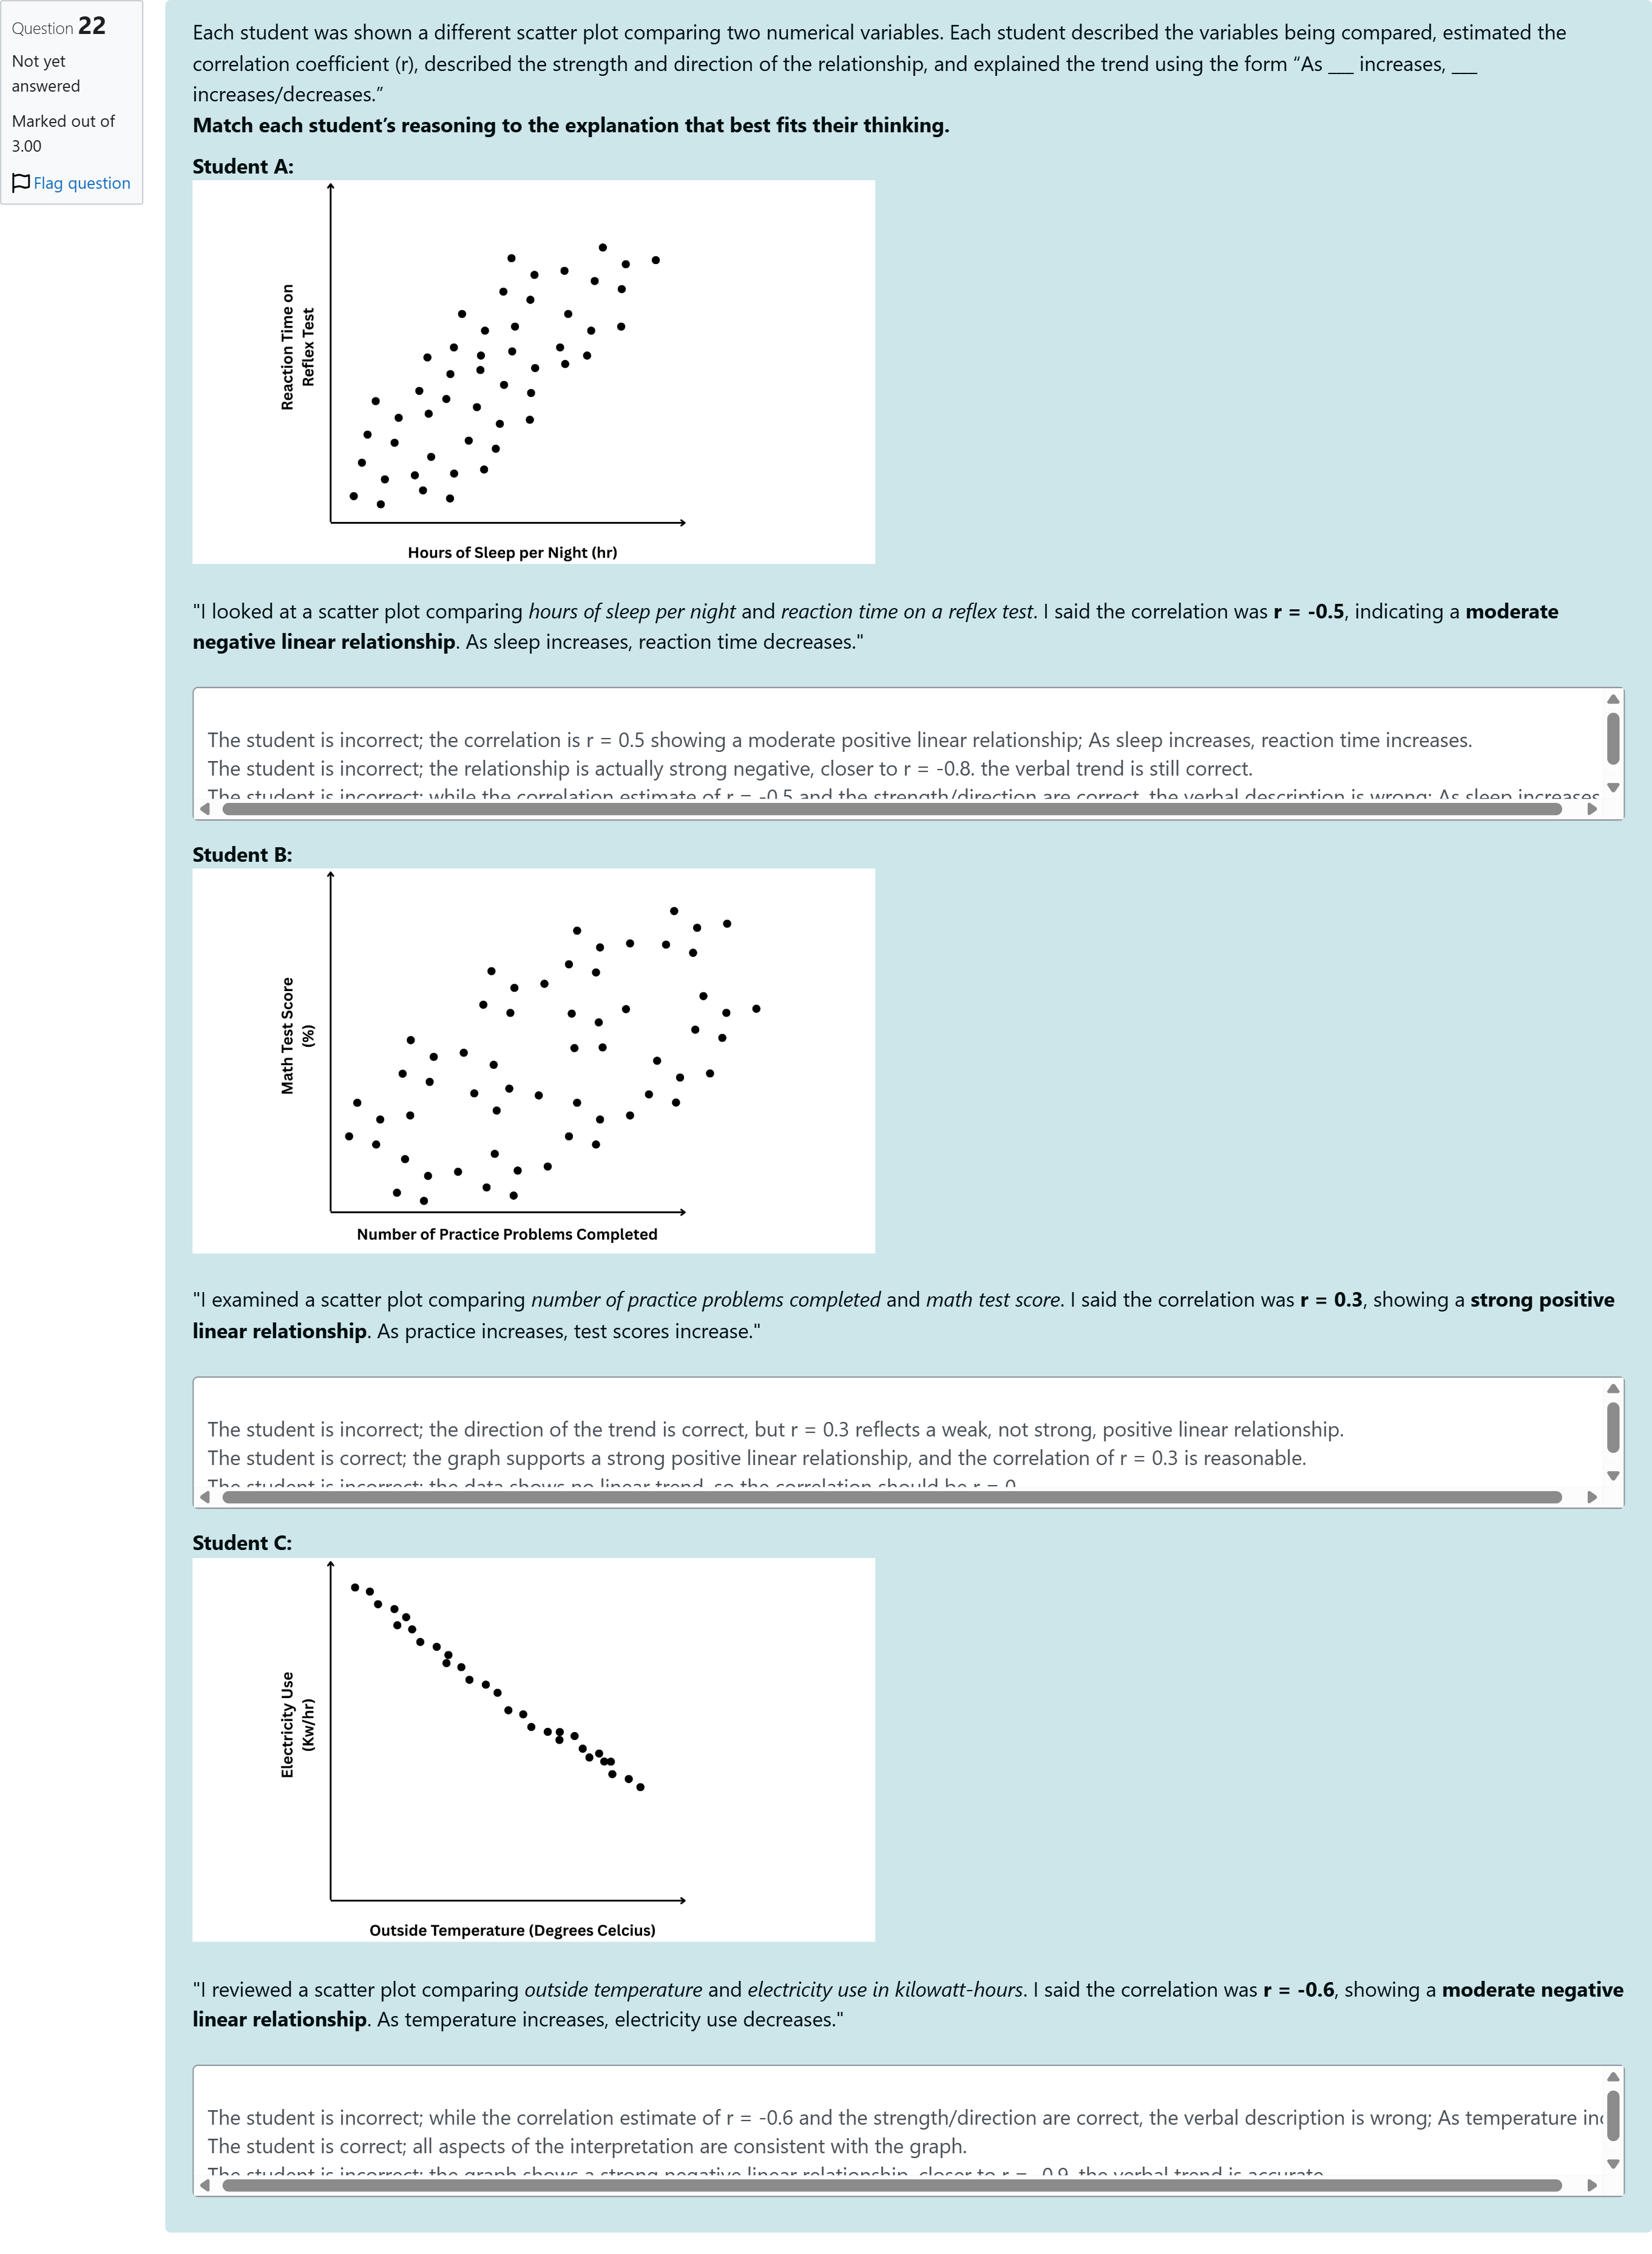
Question textEach student was shown a different scatter plot comparing two numerical variables. Each student described the variables being compared, estimated the correlation coefficient (r), described the strength and direction of the relationship, and explained the trend using the form “As ___ increases, ___ increases/decreases.”Match each student’s reasoning to the explanation that best fits their thinking. Student A:"I looked at a scatter plot comparing hours of sleep per night and reaction time on a reflex test. I said the correlation was r = -0.5, indicating a moderate negative linear relationship. As sleep increases, reaction time decreases."Answer 1 Question 22[select: , The student is incorrect; the correlation is r = 0.5 showing a moderate positive linear relationship; As sleep increases, reaction time increases., The student is incorrect; the relationship is actually strong negative, closer to r = -0.8. the verbal trend is still correct., The student is incorrect; while the correlation estimate of r = -0.5 and the strength/direction are correct, the verbal description is wrong; As sleep increases, reaction time increases.] Student B:"I examined a scatter plot comparing number of practice problems completed and math test score. I said the correlation was r = 0.3, showing a strong positive linear relationship. As practice increases, test scores increase."Answer 2 Question 22[select: , The student is incorrect; the direction of the trend is correct, but r = 0.3 reflects a weak, not strong, positive linear relationship., The student is correct; the graph supports a strong positive linear relationship, and the correlation of r = 0.3 is reasonable., The student is incorrect; the data shows no linear trend, so the correlation should be r = 0.] Student C:"I reviewed a scatter plot comparing outside temperature and electricity use in kilowatt-hours. I said the correlation was r = -0.6, showing a moderate negative linear relationship. As temperature increases, electricity use decreases."Answer 3 Question 22[select: , The student is incorrect; while the correlation estimate of r = -0.6 and the strength/direction are correct, the verbal description is wrong; As temperature increases, electricity use increases., The student is correct; all aspects of the interpretation are consistent with the graph., The student is incorrect; the graph shows a strong negative linear relationship, closer to r = -0.9. the verbal trend is accurate.]多项填空题
登录即可查看完整答案
我们收录了全球超50000道真实原题与详细解析,现在登录,立即获得答案。
类似问题
Which set of data would most likely show a positive correlation?
Question at position 62 Professor Jordan has suggested to his students that a strong relationship exists between the number of hours they spend studying and their grade on the final exam. He would like his students to improve their test scores by increasing the time they spend studying. The professor is describing amean score.negative correlation.positive correlation.standard deviation.
Question at position 35 Two variables are said to be negatively associated ifsmaller values of one variables are associated with smaller values of the otherlarger values of one variable are associated with larger value of the otherlarger values of one variable are associated with smaller values of the othersmaller values of one variables are associated with both larger or smaller values of the otherthere is no pattern in the relationship between the two variables
TB MC Qu. 10-18 Which of the following potential... Which of the following potential observations are scatter plots used to exhibit?
更多留学生实用工具
希望你的学习变得更简单
加入我们,立即解锁 海量真题 与 独家解析,让复习快人一步!