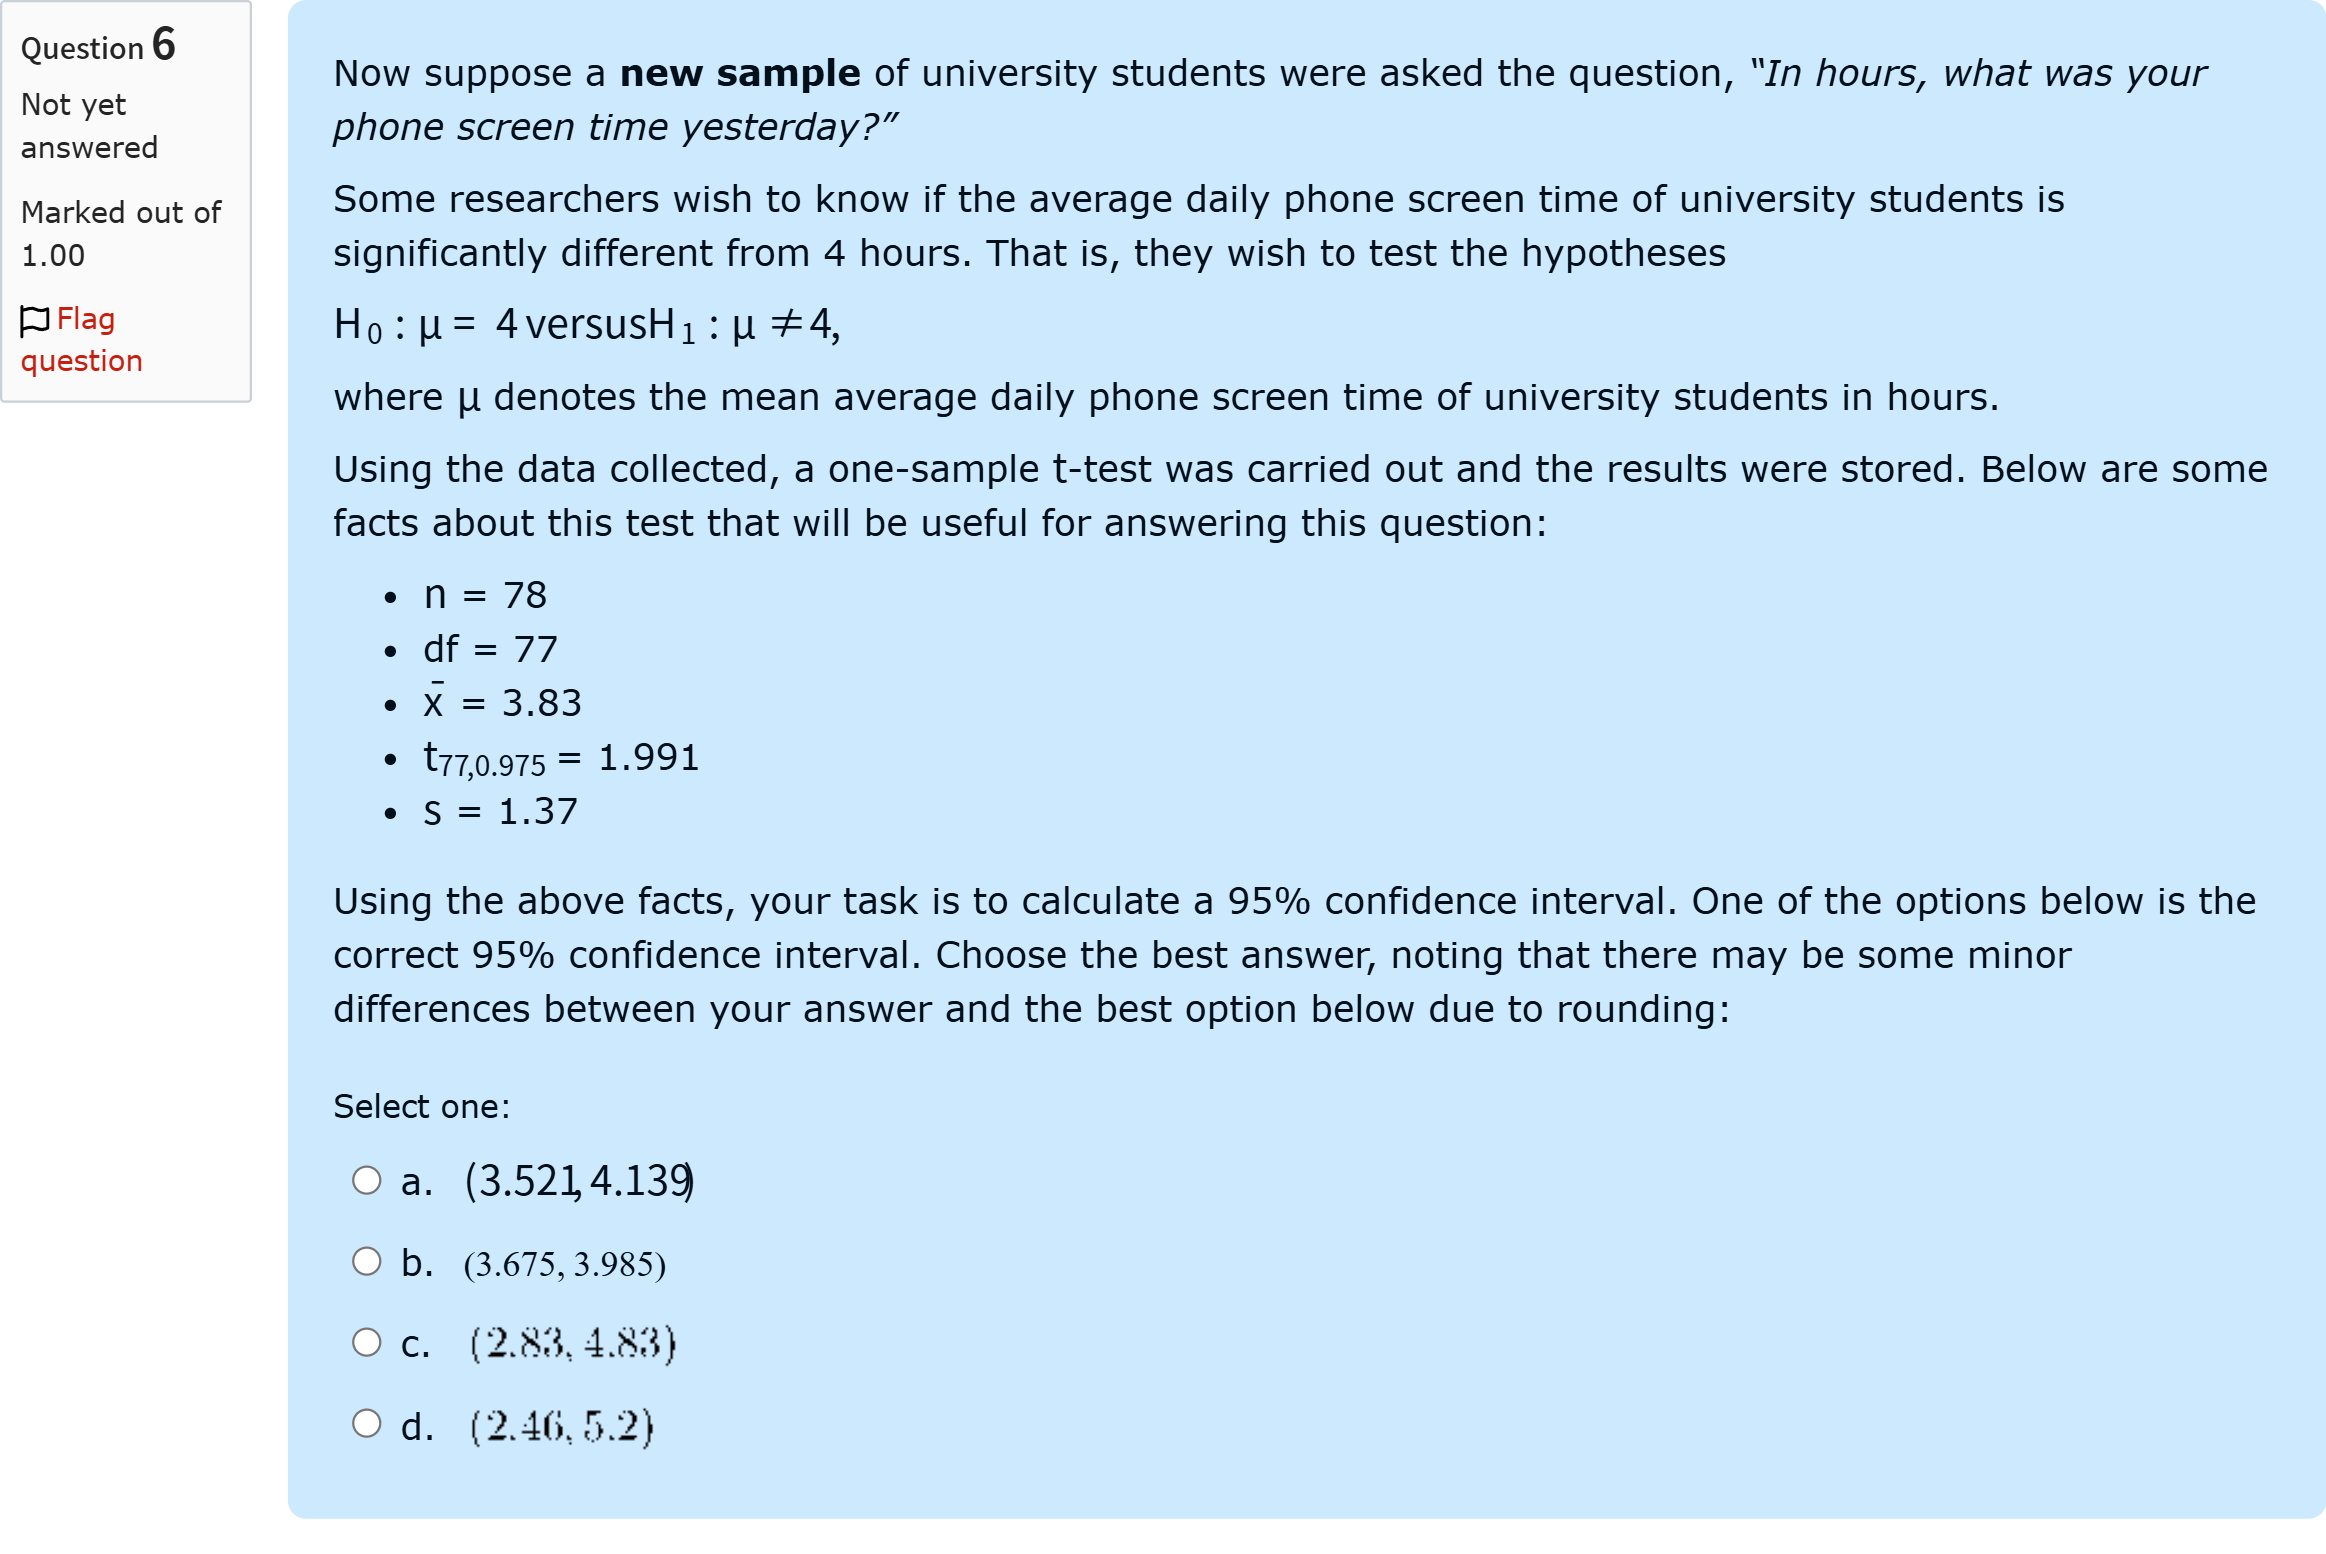
Now suppose a new sample of university students were asked the question, “In hours, what was your phone screen time yesterday?” Some researchers wish to know if the average daily phone screen time of university students is significantly different from 4 hours. That is, they wish to test the hypotheses where denotes the mean average daily phone screen time of university students in hours. Using the data collected, a one-sample -test was carried out and the results were stored. Below are some facts about this test that will be useful for answering this question: = 78 df = 77 = 3.83 = 1.991 = 1.37 Using the above facts, your task is to calculate a 95% confidence interval. One of the options below is the correct 95% confidence interval. Choose the best answer, noting that there may be some minor differences between your answer and the best option below due to rounding:单项选择题
A
a. (3.521,4.139)(3.521,4.139)
B
b. (3.675,3.985)(3.675,3.985)
C
c. (2.83,4.83)
D
d.
登录即可查看完整答案
我们收录了全球超50000道真实原题与详细解析,现在登录,立即获得答案。
类似问题
The Experimental Pulse Data (Pulse.xlsx Download Pulse.xlsx) has the resting pulse (pulse1) for a sample of 92 adults. Assuming a sample size of 92 still requires us to use t-values, the 99% confidence interval on mean resting pulse has lower bound [Fill in the blank] and upper bound [Fill in the blank] . Provide your answers to 2 decimal places.
Random samples were collected from two populations. The assumptions were checked and a 94% confidence interval for the difference of two means was constructed using this code. t.test( x1 , y1 , var.equal = FALSE , conf.level = .94 ) As you can see, there was no reason(or there was doubt) to believe that the unknown variances were equal. The results are given below. (We are assuming that this is all appropriate.) What is the upper bound on this confidence interval? Two Sample t-test data: x1 and y1 t = 1.572, df = 125, p-value = 0.049 alternative hypothesis: true difference in means is not equal to 0 94 percent confidence interval: -2.038 2.220 sample estimates: mean of x mean of y 6.585 8.247 (This question is meant to test you on your ability to find values in an R output. Many of the values given here are randomly generated and may be inconsistent with each other. Do not worry about that, this is just asking you to find a number in the output. Unless a specific warning like this is give, you should assume that the R output has not been modified. )
Have you completed all four tasks in the Case Study? You can ask your tutors for help and ask any questions during this time regarding the case study.What is the upper limit of the confidence interval for regional area?
Report the upper bound of the 95% confidence interval of the mean Travel time for Wednesday. Report your answer to 3 decimal places.
更多留学生实用工具
希望你的学习变得更简单
加入我们,立即解锁 海量真题 与 独家解析,让复习快人一步!