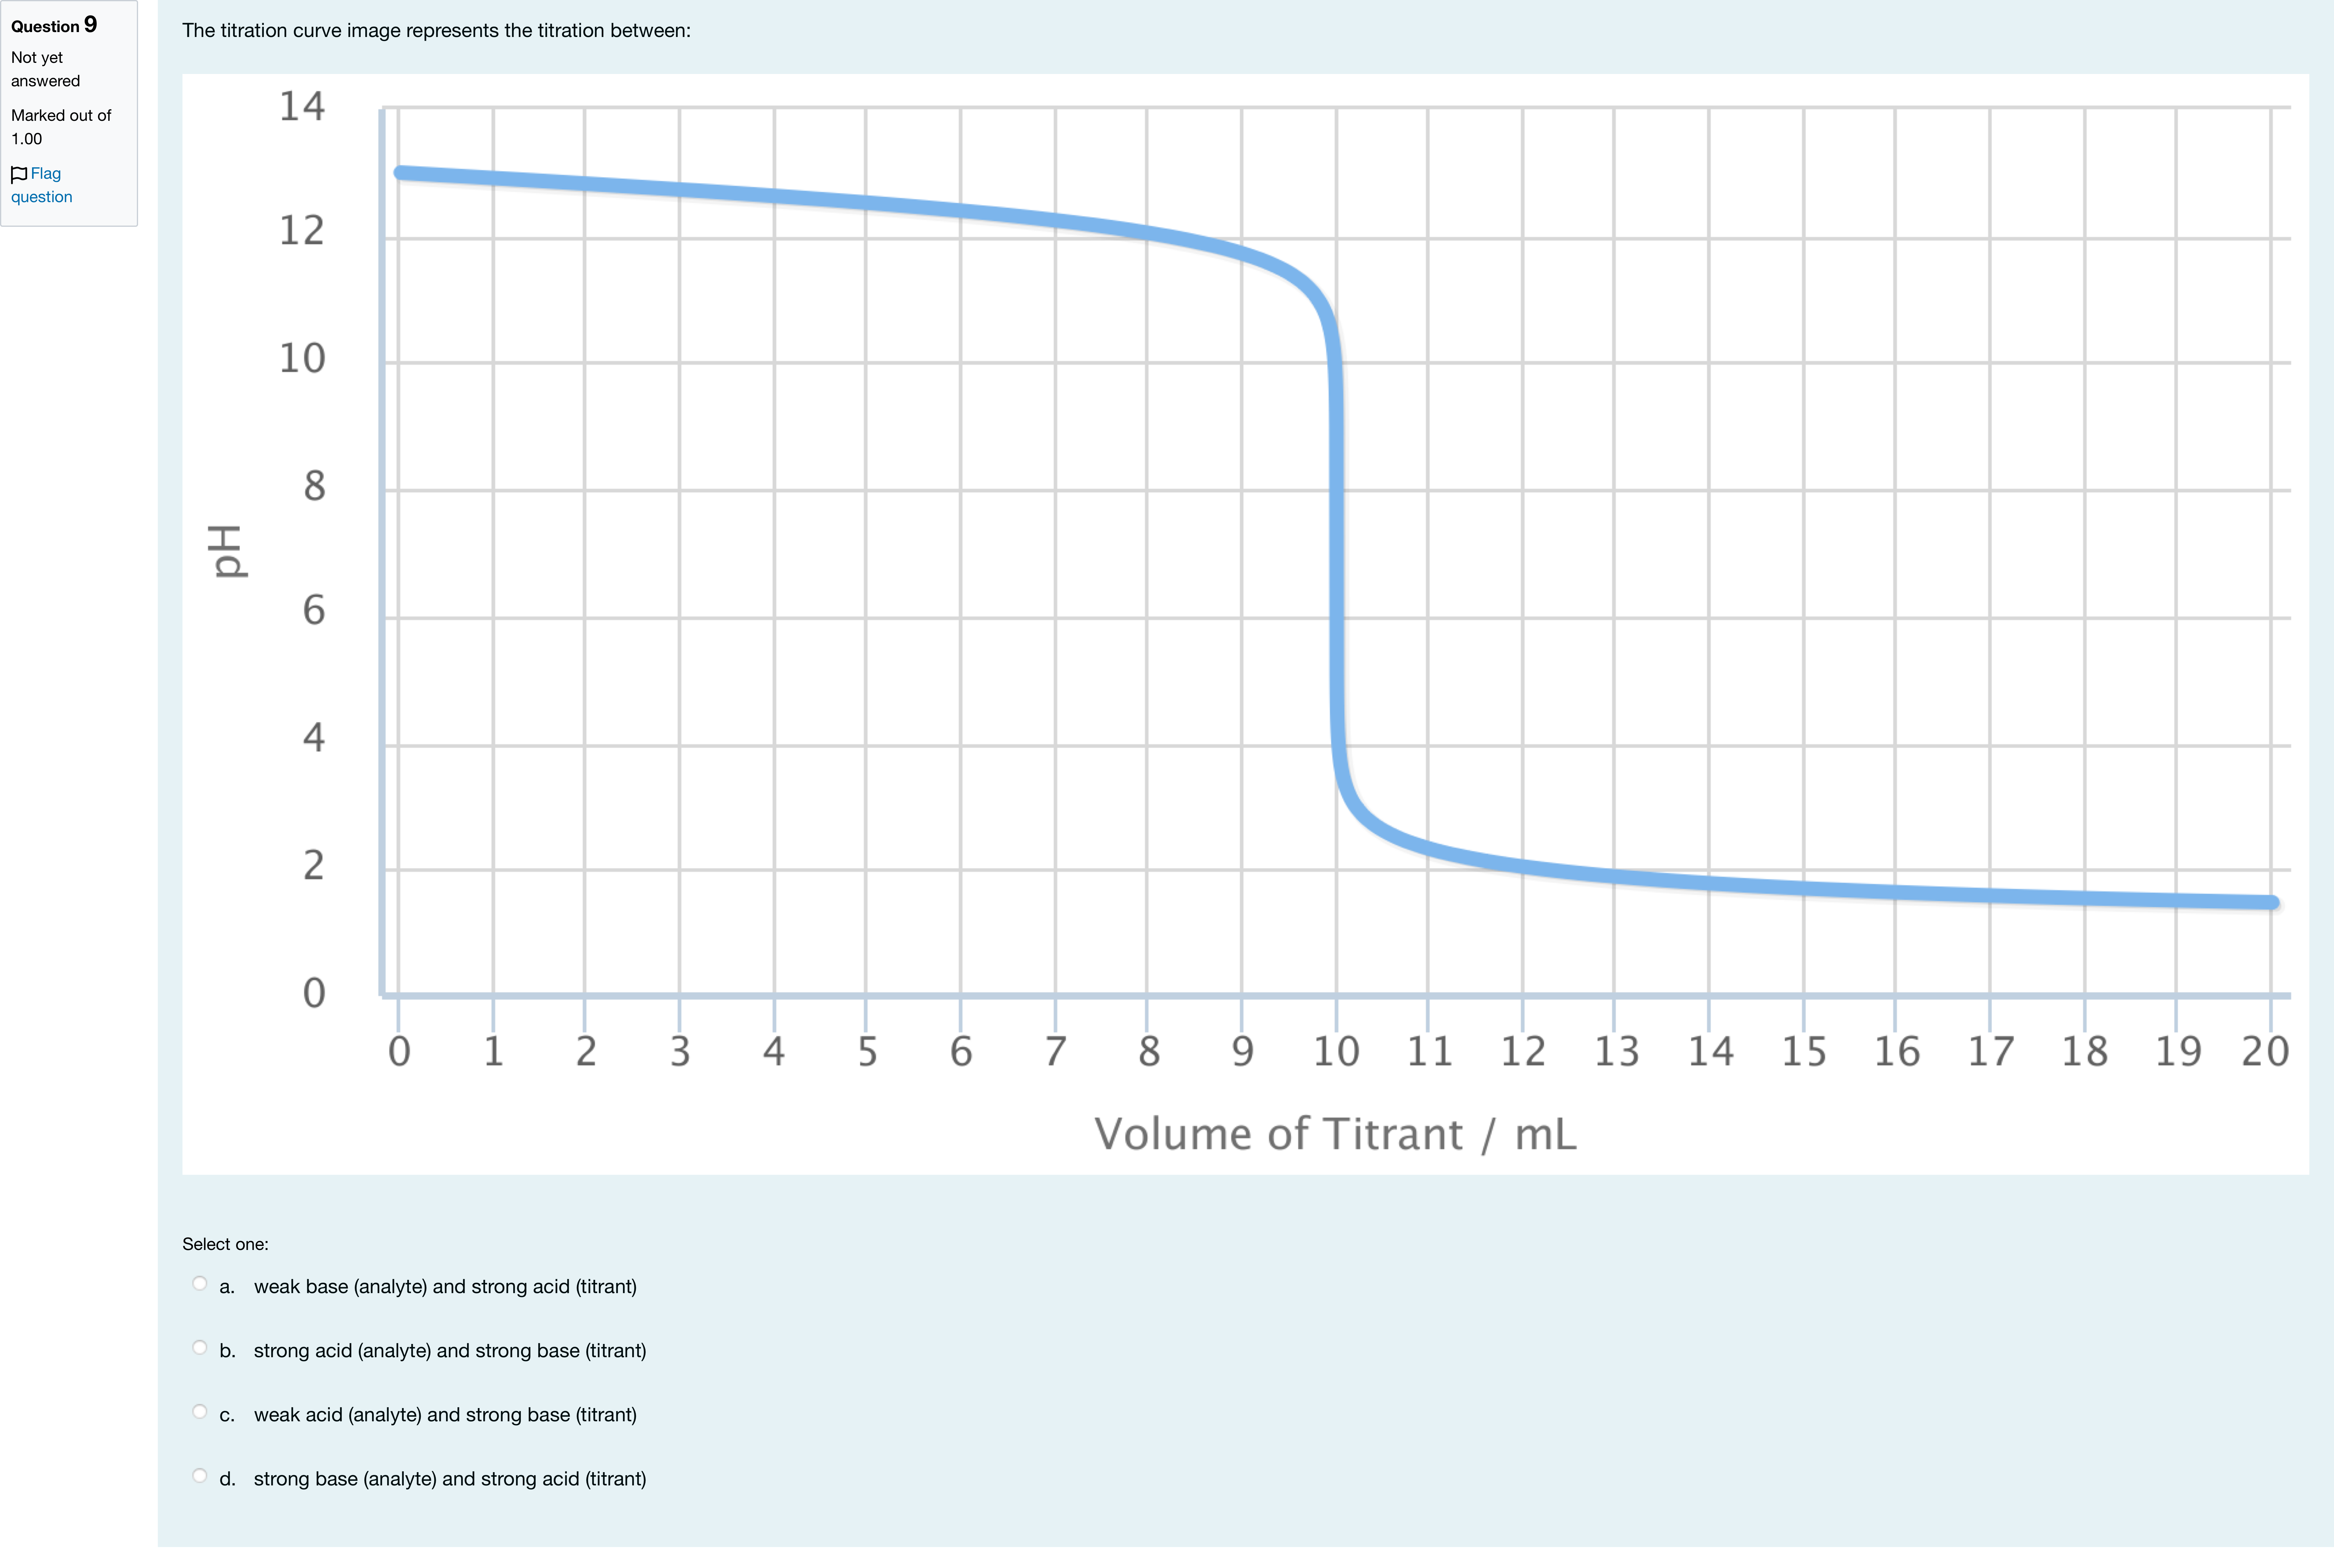
The titration curve image represents the titration between:单项选择题
A
a. weak base (analyte) and strong acid (titrant)
B
b. strong acid (analyte) and strong base (titrant)
C
c. weak acid (analyte) and strong base (titrant)
D
d. strong base (analyte) and strong acid (titrant)
登录即可查看完整答案
我们收录了全球超50000道真实原题与详细解析,现在登录,立即获得答案。
类似问题
In the titration of a weak acid with a strong base, the equivalence point is Blank 1 Question 8[select: , above, below] 7. This is due to the formation of Blank 2 Question 8[select: , a conjugate acid of a weak base, a conjugate base of a weak acid] .
Sketch a titration curve for a weak acid-strong base titration. Select the FALSE statement.
In the titration of a weak acid with a strong base, at what point does pH = pKa?
Consider the titration of HCl with NaOH. If NaOH is replaced with KOH, the pH of the equivalence point is expected to be:
更多留学生实用工具
希望你的学习变得更简单
加入我们,立即解锁 海量真题 与 独家解析,让复习快人一步!