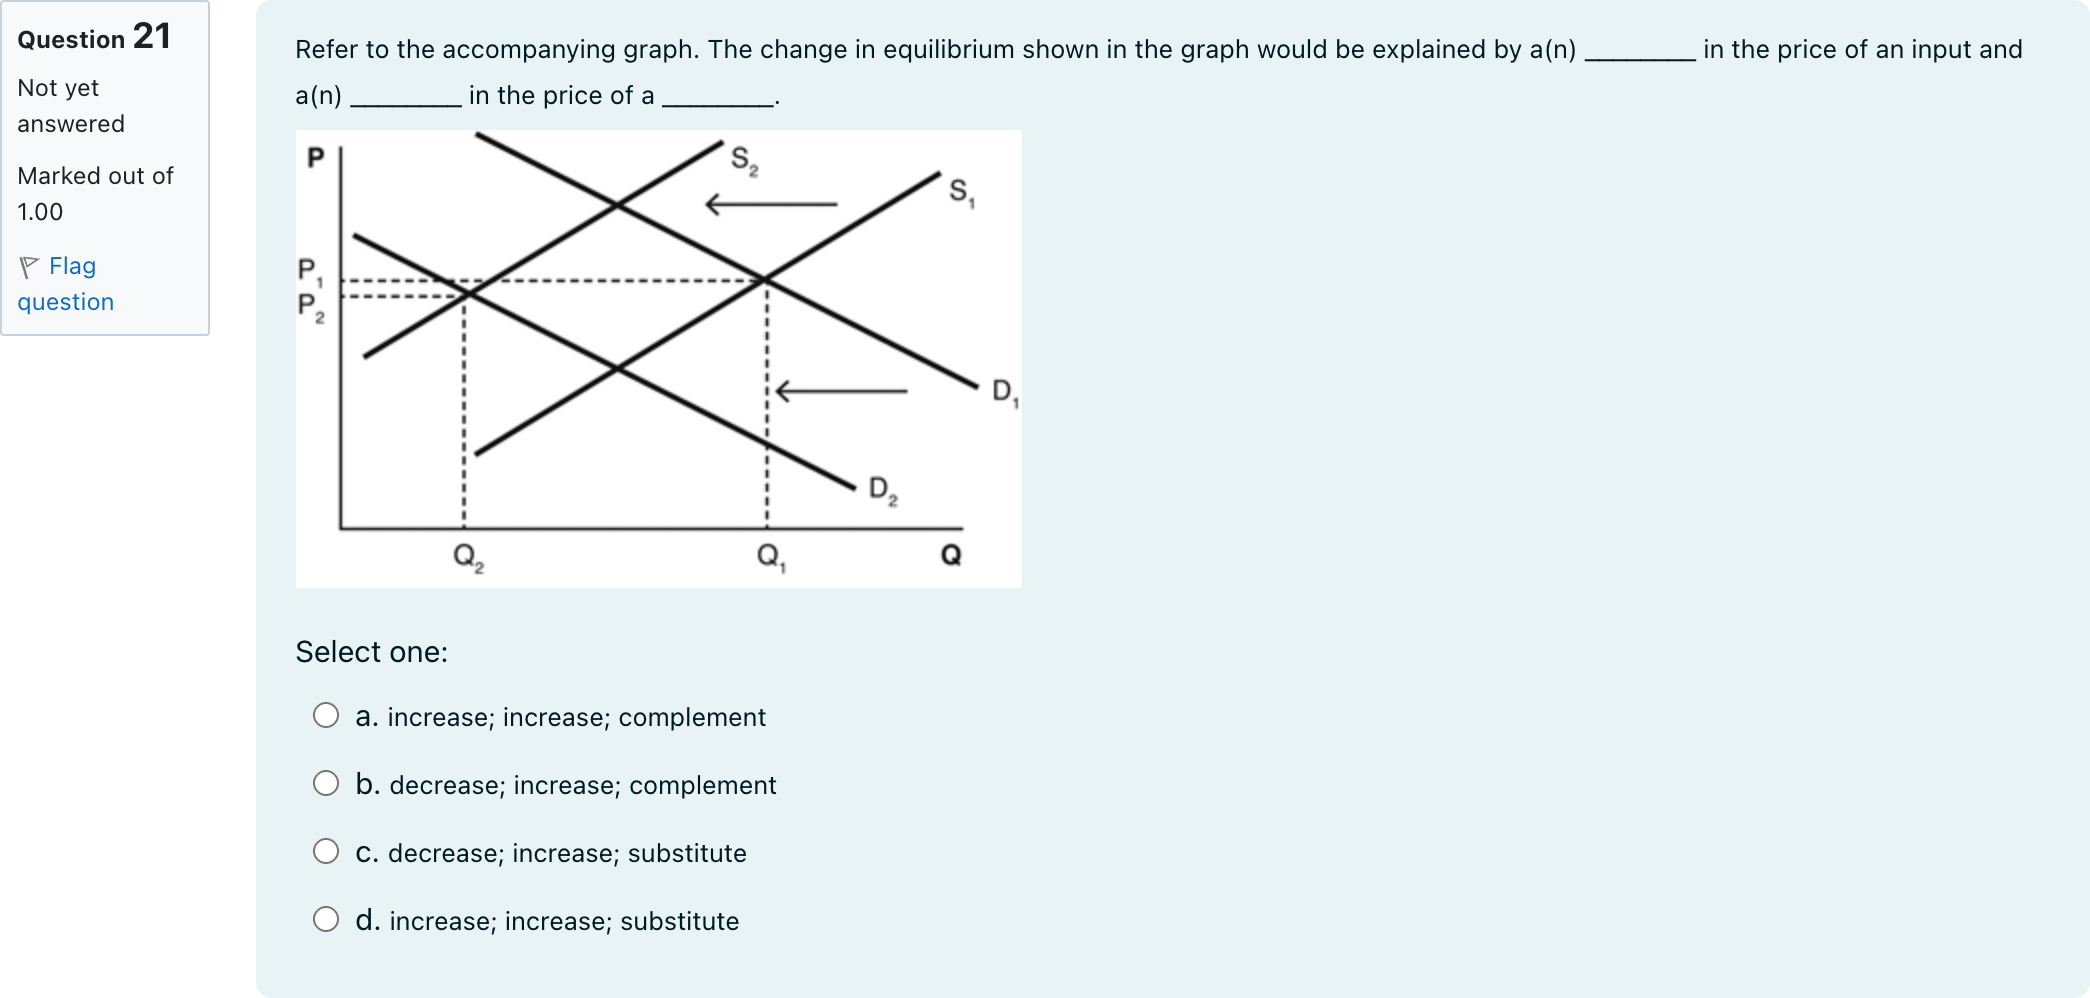
Refer to the accompanying graph. The change in equilibrium shown in the graph would be explained by a(n) ________ in the price of an input and a(n) ________ in the price of a ________.单项选择题
A
a. increase; increase; complement
B
b. decrease; increase; complement
C
c. decrease; increase; substitute
D
d. increase; increase; substitute
登录即可查看完整答案
我们收录了全球超50000道真实原题与详细解析,现在登录,立即获得答案。
类似问题
Suppose the makers of 7UP develop a new technology that makes production more efficient. At the same time, Sprite’s price goes up. What would we expect to happen to the price and quantity sold of 7UP?
What would we expect to happen to the price and quantity of Apple iPhones if the price of Samsung smartphones increases and Apple develops a new technology that makes its iPhone production process more efficient?
Refer to the following graph to answer the next question. When the price is _______ the equilibrium price, we would expect there to be a ________, causing ________ pressure on the price until it goes back to the equilibrium price.
Refer to the accompanying graph. Which of the following scenarios best describes the change in the equilibrium shown in the graph?
更多留学生实用工具
希望你的学习变得更简单
加入我们,立即解锁 海量真题 与 独家解析,让复习快人一步!