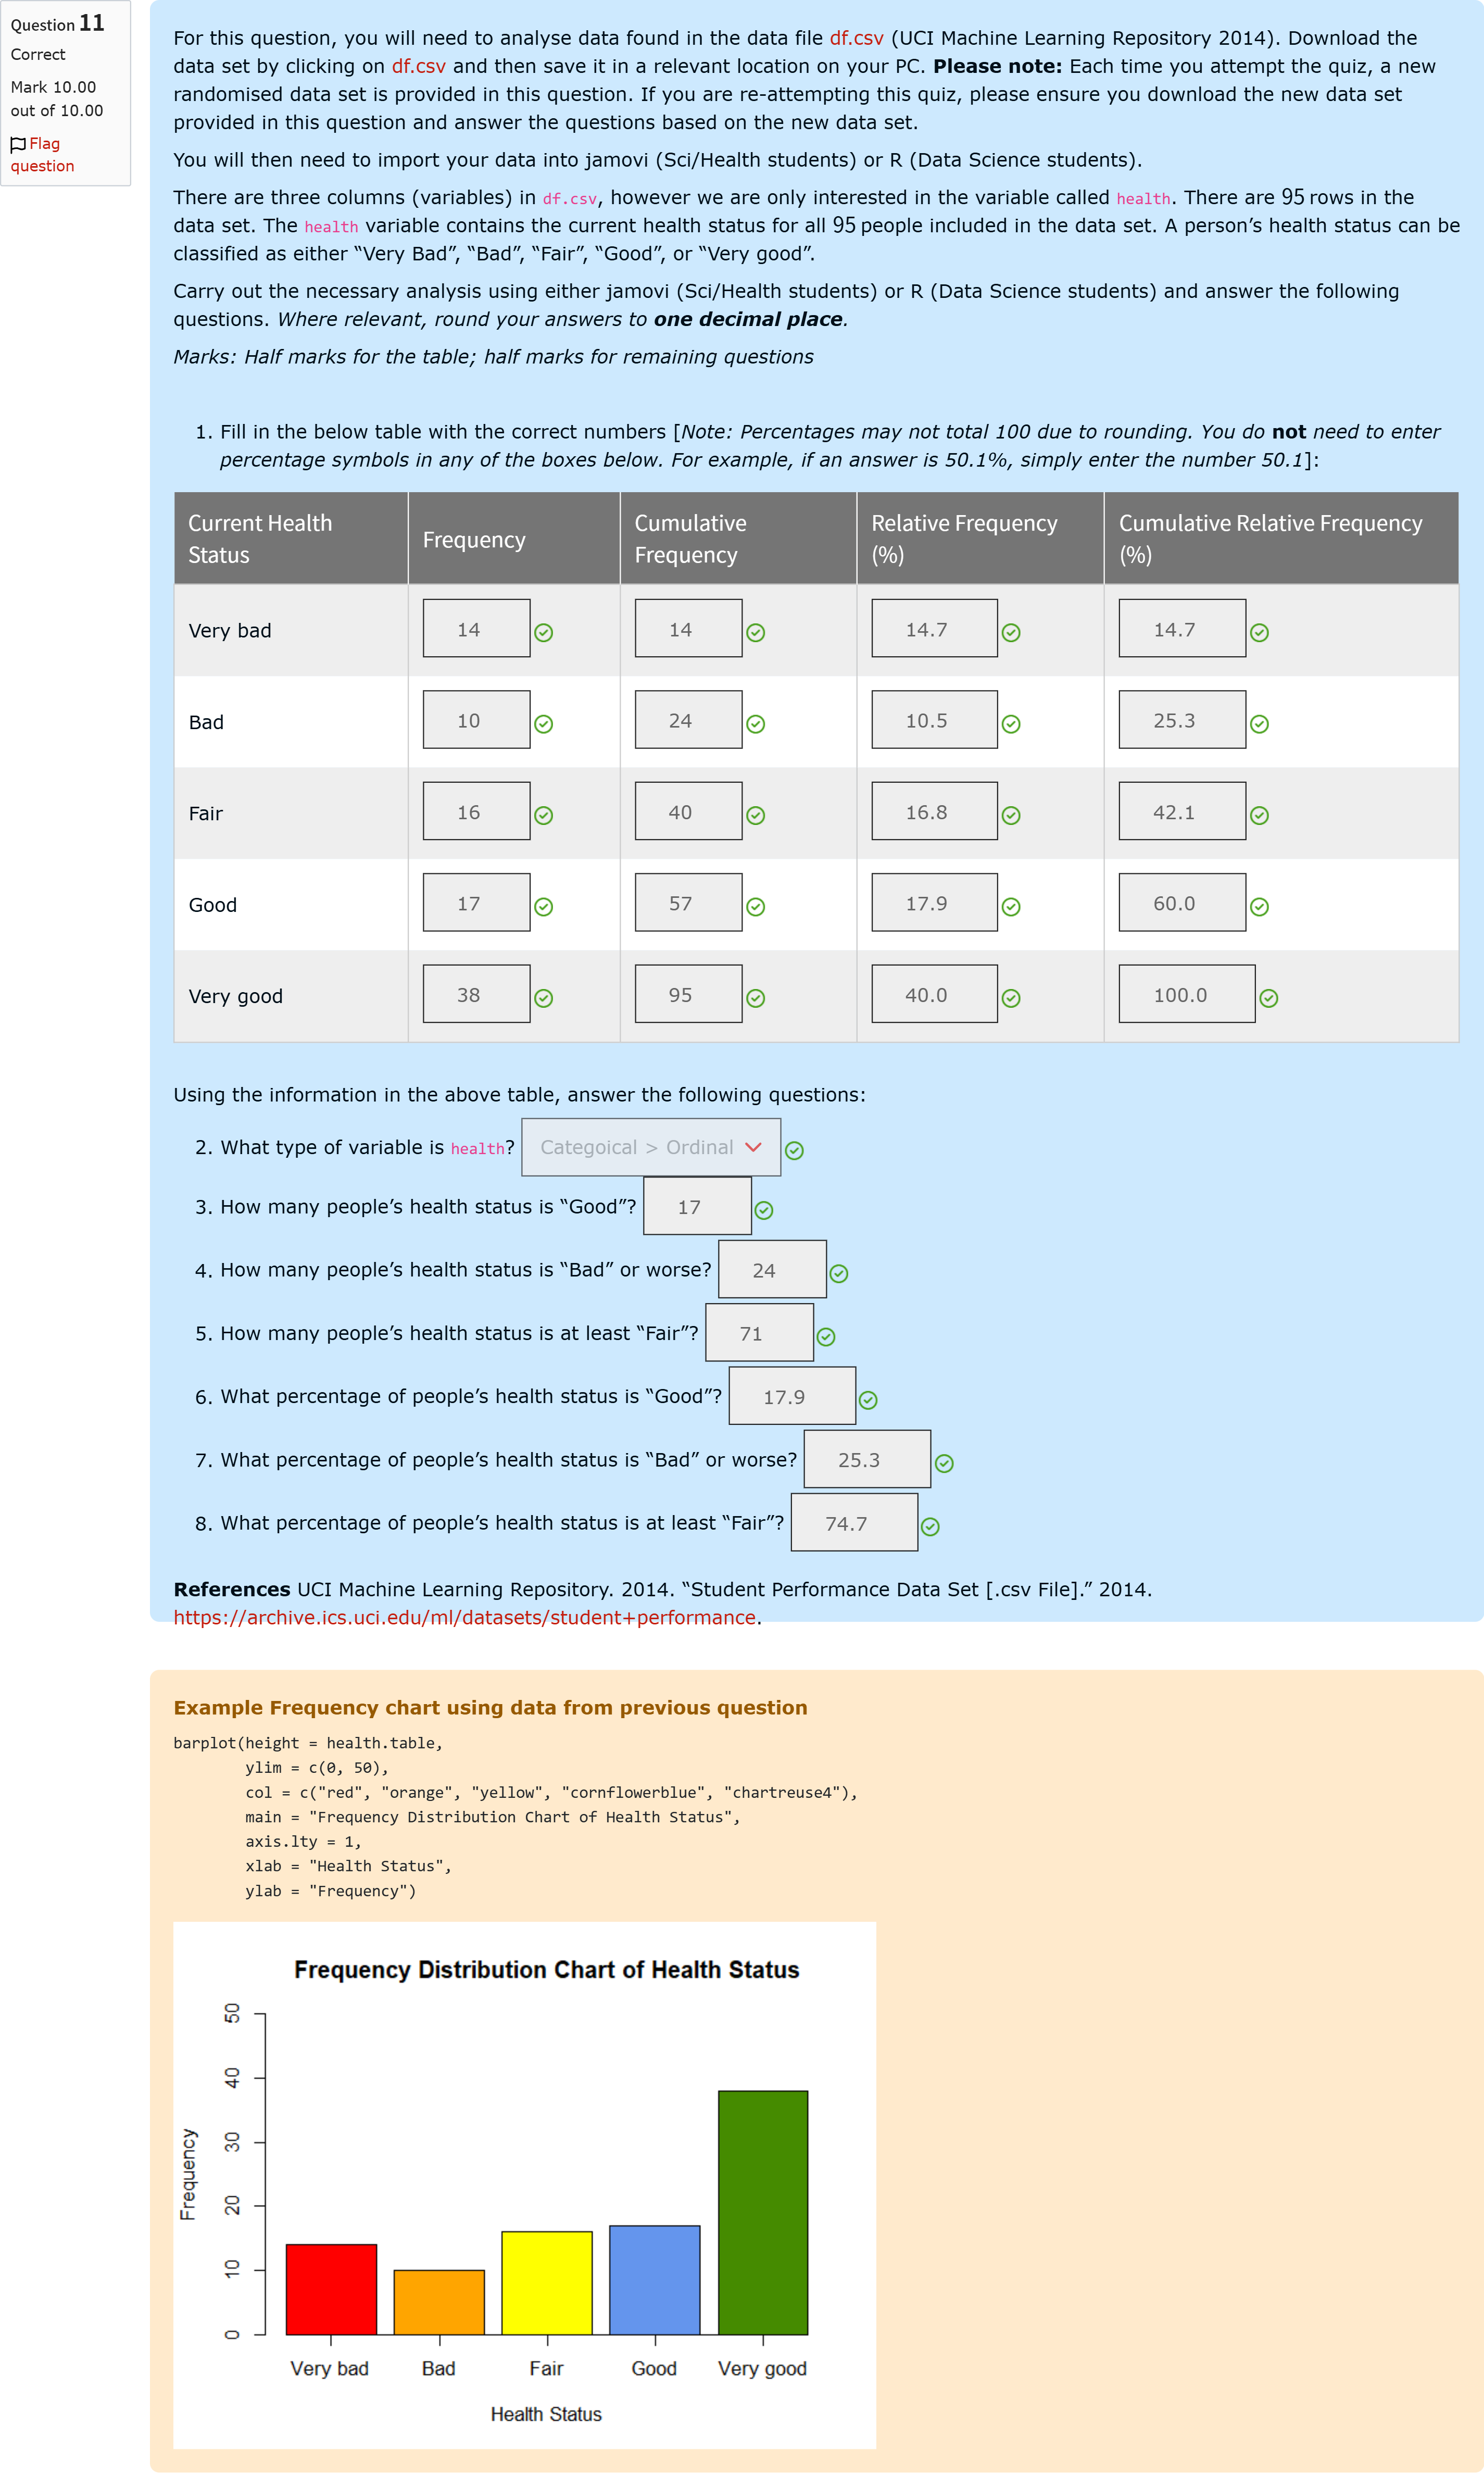
Question text For this question, you will need to analyse data found in the data file df.csv (UCI Machine Learning Repository 2014). Download the data set by clicking on df.csv and then save it in a relevant location on your PC. Please note: Each time you attempt the quiz, a new randomised data set is provided in this question. If you are re-attempting this quiz, please ensure you download the new data set provided in this question and answer the questions based on the new data set. You will then need to import your data into jamovi (Sci/Health students) or R (Data Science students). There are three columns (variables) in df.csv, however we are only interested in the variable called health. There are 9595 rows in the data set. The health variable contains the current health status for all 9595 people included in the data set. A person’s health status can be classified as either “Very Bad”, “Bad”, “Fair”, “Good”, or “Very good”. Carry out the necessary analysis using either jamovi (Sci/Health students) or R (Data Science students) and answer the following questions. Where relevant, round your answers to one decimal place. Marks: Half marks for the table; half marks for remaining questions Fill in the below table with the correct numbers [Note: Percentages may not total 100 due to rounding. You do not need to enter percentage symbols in any of the boxes below. For example, if an answer is 50.1%, simply enter the number 50.1]: [table] Current Health Status | Frequency | Cumulative Frequency | Relative Frequency (%) | Cumulative Relative Frequency (%) Very bad | Answer 1 Question 11 | Answer 2 Question 11 | Answer 3 Question 11 | Answer 4 Question 11 Bad | Answer 5 Question 11 | Answer 6 Question 11 | Answer 7 Question 11 | Answer 8 Question 11 Fair | Answer 9 Question 11 | Answer 10 Question 11 | Answer 11 Question 11 | Answer 12 Question 11 Good | Answer 13 Question 11 | Answer 14 Question 11 | Answer 15 Question 11 | Answer 16 Question 11 Very good | Answer 17 Question 11 | Answer 18 Question 11 | Answer 19 Question 11 | Answer 20 Question 11 [/table] Using the information in the above table, answer the following questions: What type of variable is health? Answer 21 Question 11[select: , Categorical > Nominal, Categoical > Ordinal, Numeric > Discrete, Numeric > Continuous] How many people’s health status is “Good”? Answer 22 Question 11[input] How many people’s health status is “Bad” or worse? Answer 23 Question 11[input] How many people’s health status is at least “Fair”? Answer 24 Question 11[input] What percentage of people’s health status is “Good”? Answer 25 Question 11[input] What percentage of people’s health status is “Bad” or worse? Answer 26 Question 11[input] What percentage of people’s health status is at least “Fair”? Answer 27 Question 11[input] References UCI Machine Learning Repository. 2014. “Student Performance Data Set [.csv File].” 2014. https://archive.ics.uci.edu/ml/datasets/student+performance.多项填空题
登录即可查看完整答案
我们收录了全球超50000道真实原题与详细解析,现在登录,立即获得答案。
类似问题
2. Approximately Answer Question 2[input]% of Australian teenagers often continue to use social media after 1am.
2. Approximately Answer Question 2[input] of Australian teenagers often continue to use social media after 1am.
Report the skewness statistic of the journey elapsed time amongst respondents who do not live in regional areas. Report your answer to 2 decimal places.
In the workshop example, the best way to demonstrate the statistically significant differences in a discussion section would be to include:
更多留学生实用工具
希望你的学习变得更简单
加入我们,立即解锁 海量真题 与 独家解析,让复习快人一步!