What is represented in this image?单项选择题
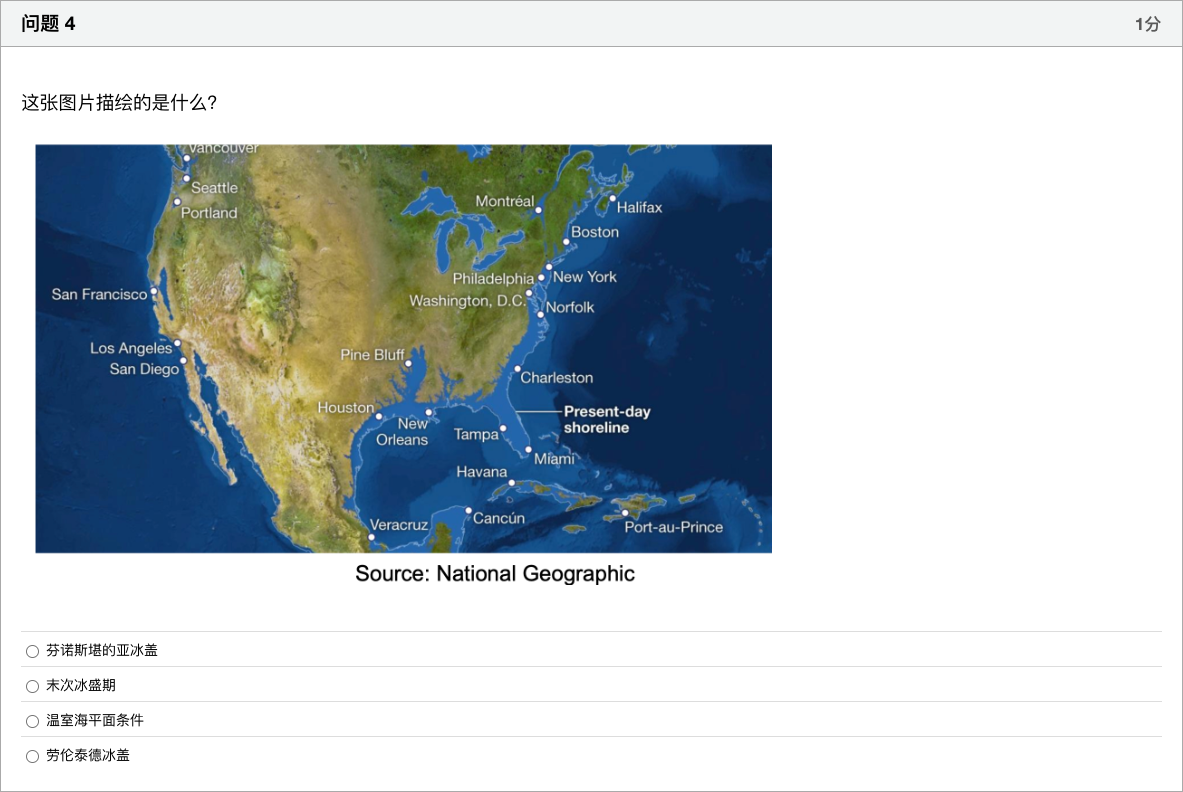
A
Fennoscandian Ice Sheet
B
Last Glacial Maximum
C
Greenhouse sea level conditions
D
Laurentide Ice Sheet
登录即可查看完整答案
我们收录了全球超50000道真实原题与详细解析,现在登录,立即获得答案。
类似问题
这张地图显示的是哪个区域,描绘的是什么过程?
Is the sea-level drop predicted for Greenland likely to be a global phenomena? In other words, would places like Florida and Hawaii also see lower sea levels?
Sea-level for Greenland is expected to drop in the coming decades. Why?
Which of the following would cause sea level to fall (lower)?
更多留学生实用工具
希望你的学习变得更简单
加入我们,立即解锁 海量真题 与 独家解析,让复习快人一步!