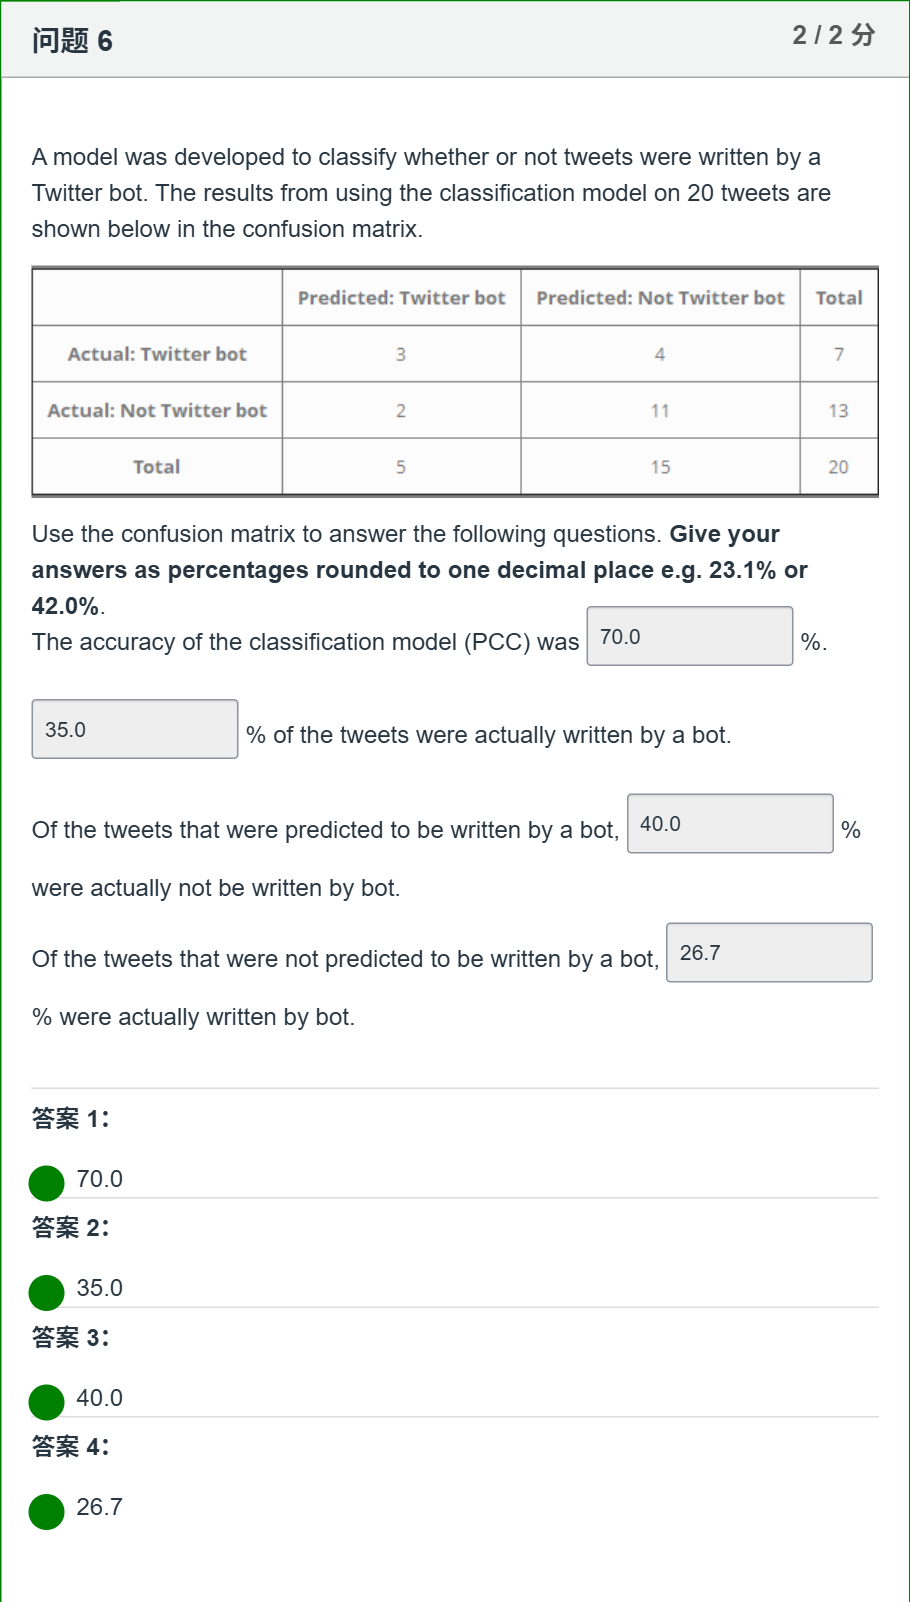
A model was developed to classify whether or not tweets were written by a Twitter bot. The results from using the classification model on 20 tweets are shown below in the confusion matrix.Use the confusion matrix to answer the following questions. Give your answers as percentages rounded to one decimal place e.g. 23.1% or 42.0%.The accuracy of the classification model (PCC) was [Fill in the blank] %.[Fill in the blank] % of the tweets were actually written by a bot.Of the tweets that were predicted to be written by a bot, [Fill in the blank] % were actually not be written by bot.Of the tweets that were not predicted to be written by a bot, [Fill in the blank] % were actually written by bot. Multiple fill-in-the-blank
Log in for full answers
We've collected over 50,000 authentic original questions and detailed explanations from around the globe. Log in now and get instant access to the answers!
Similar Questions
A random sample of tweets made by @AucklandUni was obtained. Load the dataset into iNZight Lite using this link and produce relevant summary statistics to answer the questions below. Note: When you are using two categorical variables, the order you put variables into iNZight Lite does affect the frequency table in the summary so consider this carefully. Give your answers as percentages rounded to one decimal place e.g. 23.1% or 42.0%. What proportion of the tweets used hashtags?[Fill in the blank] % What proportion of the tweets were tweeted between 2019 to 2020?[Fill in the blank] % Of the tweets that used no hashtags, what proportion were tweeted between 2019 to 2020?[Fill in the blank] % Of the tweets that were tweeted between 2021 to 2022, what proportion used hashtags?[Fill in the blank] %
A random sample of tweets made by @AucklandUni was obtained. Load the dataset into iNZight Lite using this link and produce relevant summary statistics to answer the questions below. Note: When you are using two categorical variables, the order you put variables into iNZight Lite does affect the frequency table in the summary so consider this carefully. Give your answers as percentages rounded to one decimal place e.g. 23.1% or 42.0%. What proportion of the tweets were tweeted in the afternoon or evening (PM)?[Fill in the blank] % What proportion of the tweets were tweeted on a Monday?[Fill in the blank] % Of the tweets that were tweeted on a Monday, what proportion were tweeted in the afternoon or evening (PM)?[Fill in the blank] % Of the tweets that were tweeted in the morning (AM), what proportion were tweeted on a Thursday?[Fill in the blank] %
A model was developed to classify whether or not tweets were written by a Twitter bot. The results from using the classification model on 36 tweets are shown below in the confusion matrix.Use the confusion matrix to answer the following questions. Give your answers as percentages rounded to one decimal place e.g. 23.1% or 42.0%.The accuracy of the classification model (PCC) was [Fill in the blank] %.[Fill in the blank] % of the tweets were predicted to be written by a bot.Of the tweets that were not actually written by a bot, [Fill in the blank] % were correctly predicted to not be written by bot.Of the tweets that were not actually written by a bot, [Fill in the blank] % were incorrectly predicted to be written by bot.
Consider the following scenario: “You are asked to guess the position of a coin that is thrown into a pond. You are given two pieces of information: 1) the person throwing the coin is aiming at the middle of the pond, and 2) you can see the positions of the splashes that the coin makes when falling in the water.” What’s your best guess about where the coin fell?
More Practical Tools for Students Powered by AI Study Helper
Making Your Study Simpler
Join us and instantly unlock extensive past papers & exclusive solutions to get a head start on your studies!