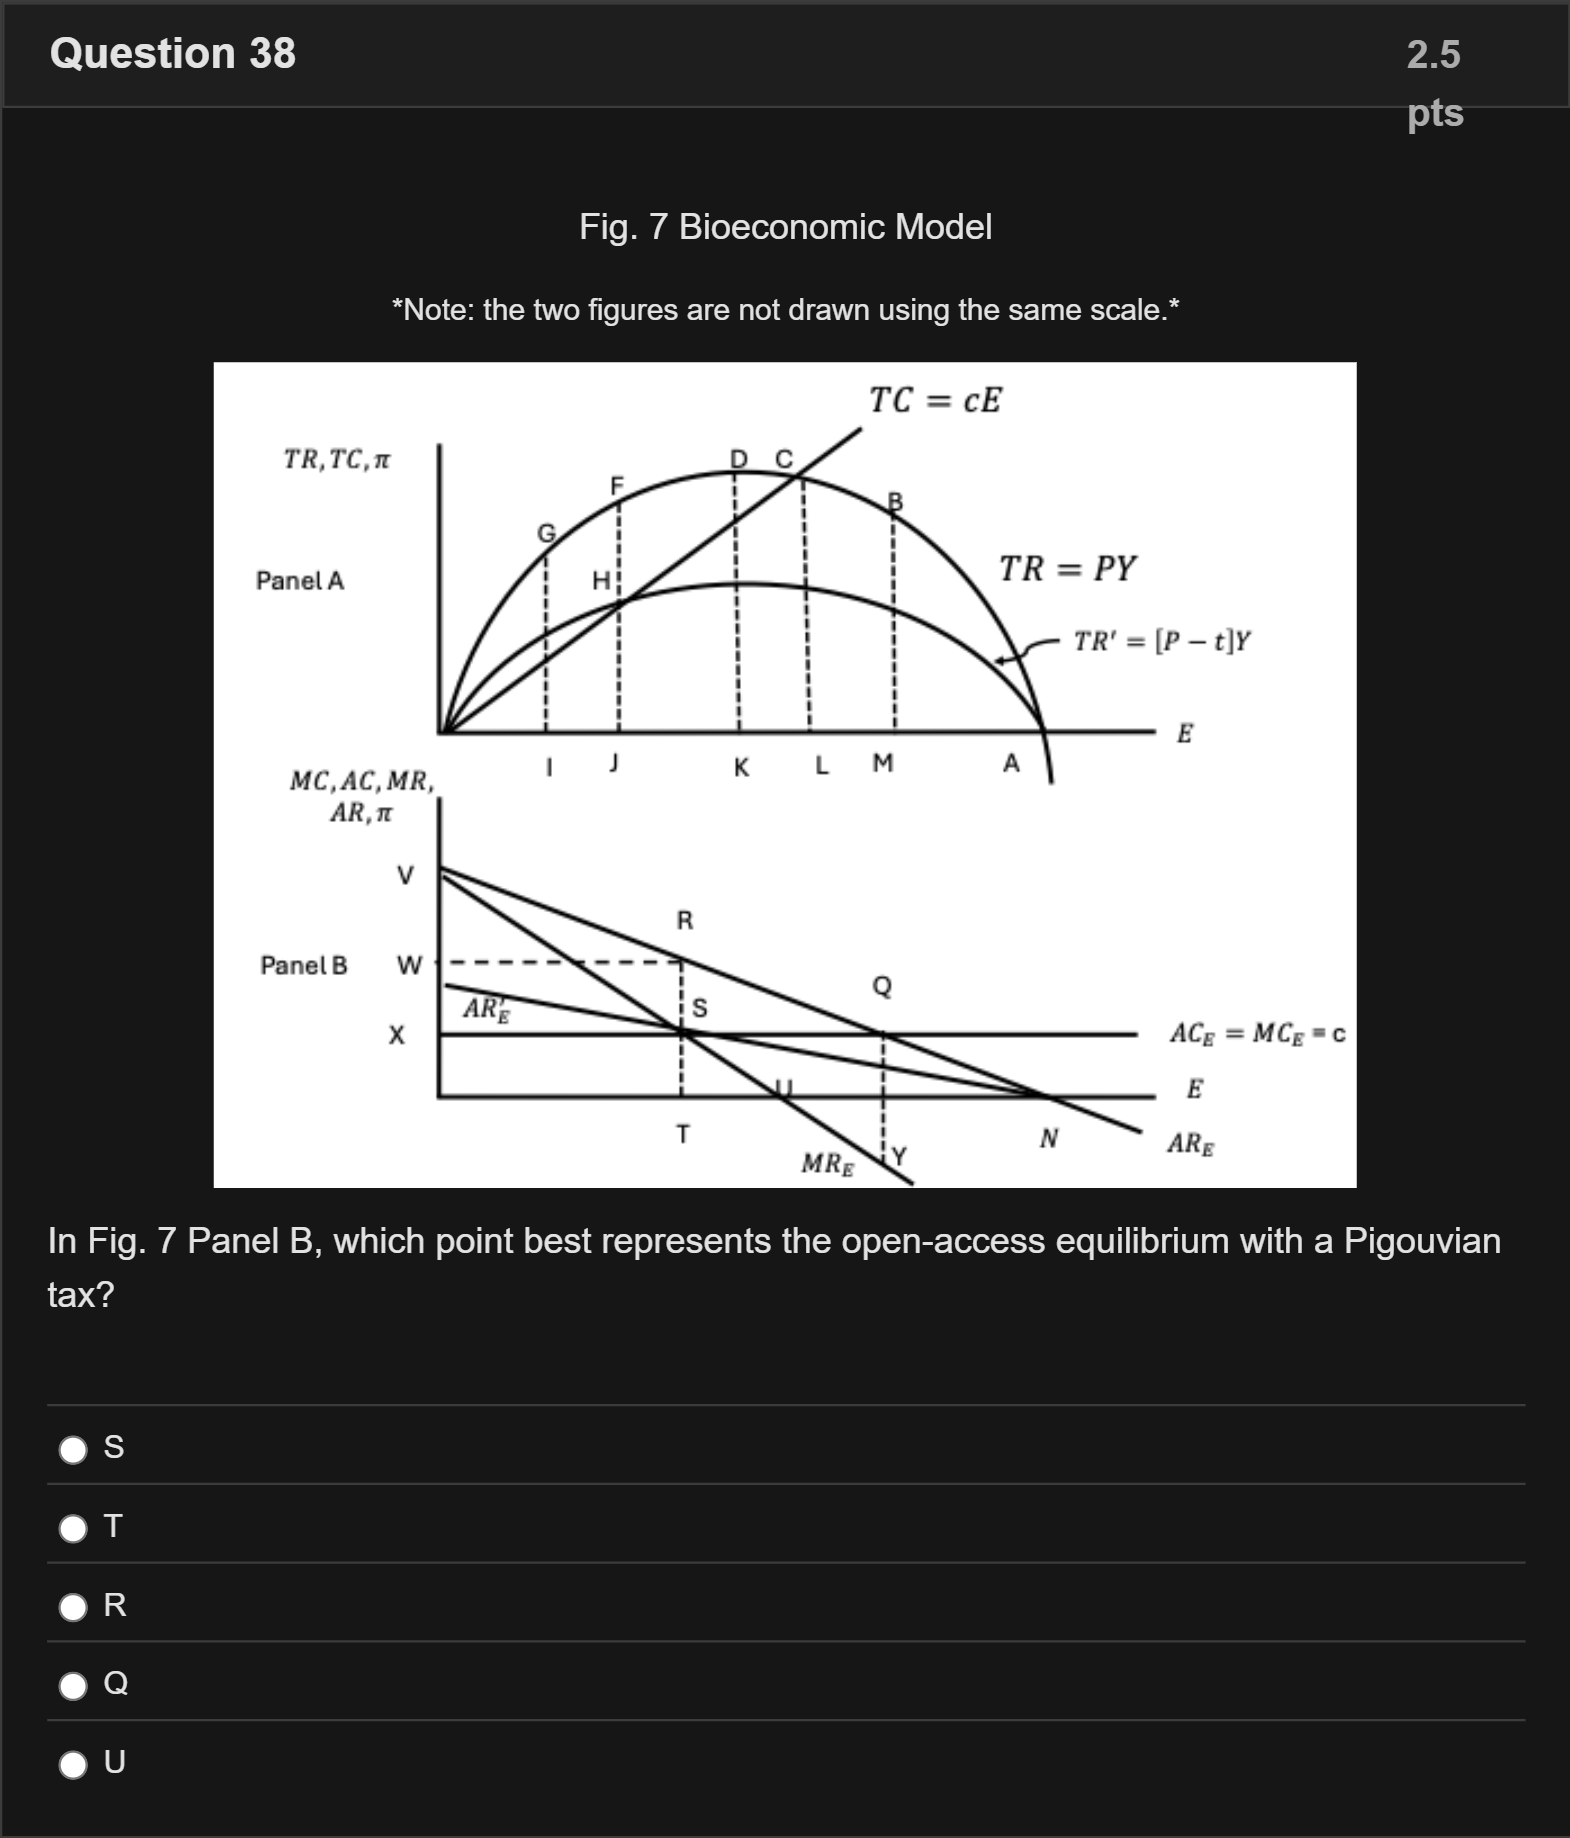
Fig. 7 Bioeconomic Model *Note: the two figures are not drawn using the same scale.* In Fig. 7 Panel B, which point best represents the open-access equilibrium with a Pigouvian tax? 单项选择题
A
S
B
T
C
R
D
Q
E
U
登录即可查看完整答案
我们收录了全球超50000道真实原题与详细解析,现在登录,立即获得答案。
类似问题
When production or consumption of a product results in negative externalities, a suitable method of government intervention may be
When the production of a good creates negative externalities, which of the following leads to the socially optimal quantity of output?
The graph below shows the marginal social cost, supply, and marginal social benefit in an industry that generates pollution. Use this graph to answer Questions 53 and 54. Suppose the industry is currently producing the quantity Q2 and the price is $100. If a Pigouvian tax equal to the marginal external cost is imposed, what will happen to society’s total surplus and the deadweight loss in the industry? Total surplus Deadweight loss A. decrease stay the same B. increase decrease C. increase increase D. decrease decrease E. increase stay the same
Is the following statement true or false? In the products of methylation-hydrolysis, every -OH group corresponds to the position of a glycosidic bond in the starting polysaccharide.
更多留学生实用工具
希望你的学习变得更简单
加入我们,立即解锁 海量真题 与 独家解析,让复习快人一步!