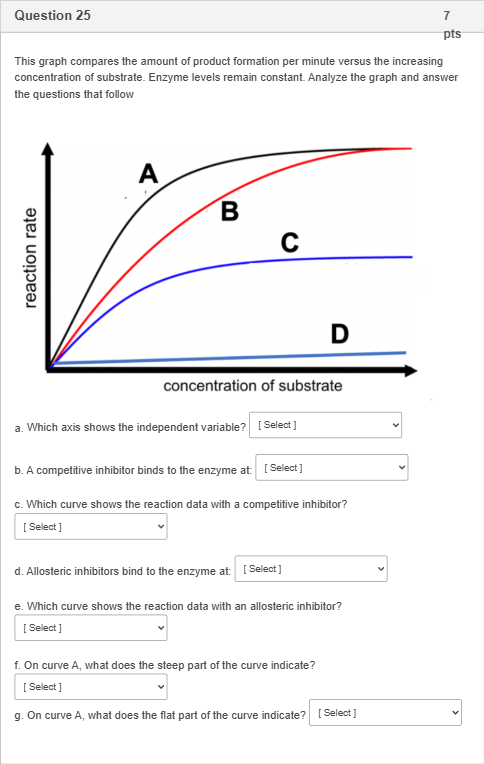
This graph compares the amount of product formation per minute versus the increasing concentration of substrate. Enzyme levels remain constant. Analyze the graph and answer the questions that follow a. Which axis shows the independent variable? [ Select ] ["vertical Y axis", "horizontal X axis", "both"] b. A competitive inhibitor binds to the enzyme at: [ Select ] ["the active site", "both", "another site on enzyme"] c. Which curve shows the reaction data with a competitive inhibitor? [ Select ] ["C", "B", "A", "D"] d. Allosteric inhibitors bind to the enzyme at: [ Select ] ["another site on enzyme", "both", "the active site"] e. Which curve shows the reaction data with an allosteric inhibitor? [ Select ] ["E", "B", "C", "A", "D"] f. On curve A, what does the steep part of the curve indicate? [ Select ] ["E<S", "E>S", "E=S"] g. On curve A, what does the flat part of the curve indicate? [ Select ] ["E>S", "E=S", "E<S"] 多重下拉选择题
登录即可查看完整答案
我们收录了全球超50000道真实原题与详细解析,现在登录,立即获得答案。
类似问题
Is the following statement true or false? In the products of methylation-hydrolysis, every -OH group corresponds to the position of a glycosidic bond in the starting polysaccharide.
Which of the follwoing structures represents amylopectin?
Which of the following is true about an aldopentose?I. It is a monosaccharide.II. It contains a CHO groupIII. It is a disaccharide.IV. It is an oligosaccharide.
For stock A, we have 𝛽 𝑖 = 0.70. Suppose the expected market risk premium next year is 9% and the risk-free rate is 3%. What is the expected return of this stock based on the CAPM? (Please answer in % and round to 2 decimal places. If the answer is 8.057%, then in the box, write 8.06)
更多留学生实用工具
希望你的学习变得更简单
加入我们,立即解锁 海量真题 与 独家解析,让复习快人一步!