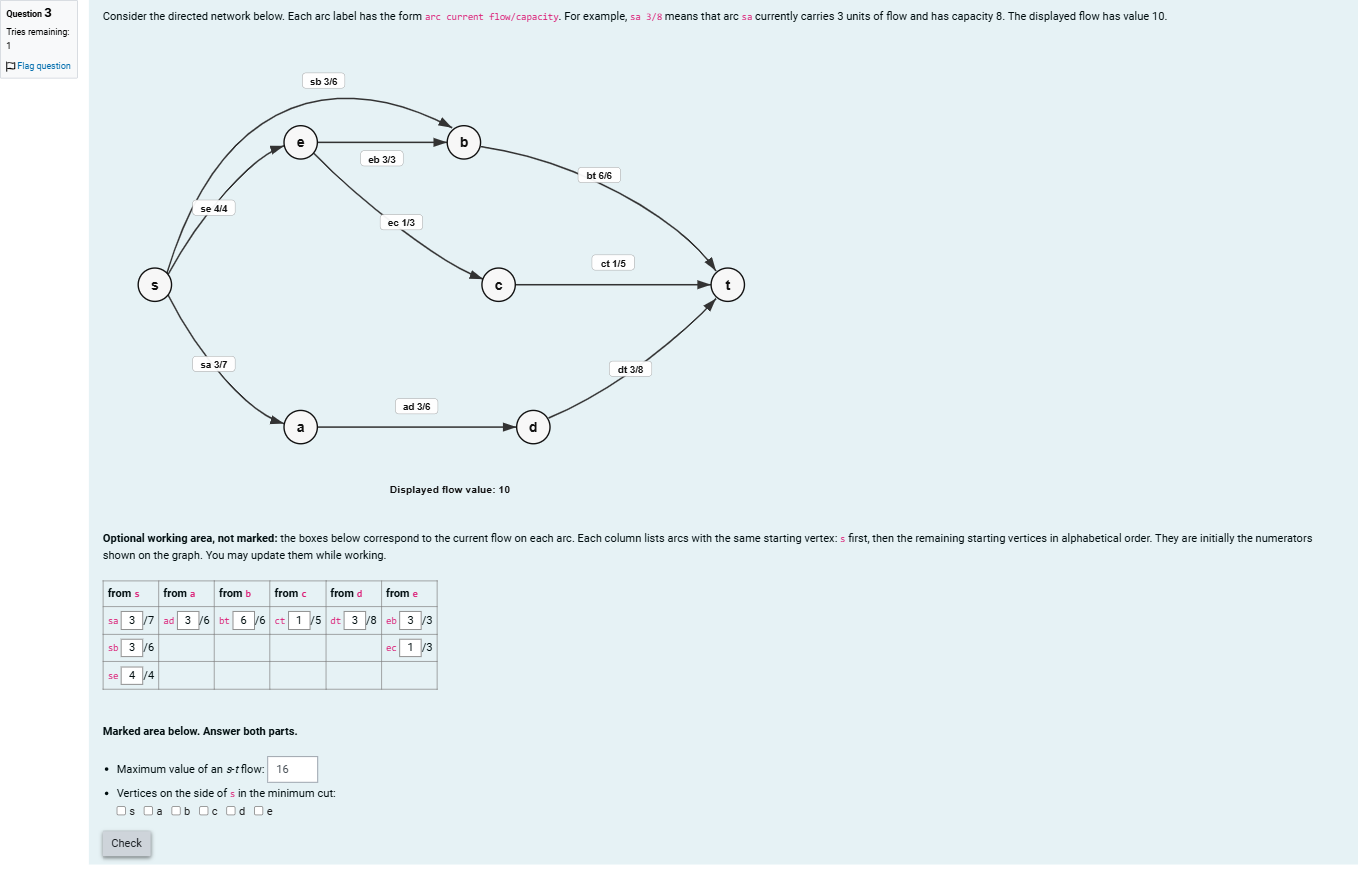
Question textConsider the directed network below. Each arc label has the form arc current flow/capacity. For example, sa 3/8 means that arc sa currently carries 3 units of flow and has capacity 8. The displayed flow has value 10. Optional working area, not marked: the boxes below correspond to the current flow on each arc. Each column lists arcs with the same starting vertex: s first, then the remaining starting vertices in alphabetical order. They are initially the numerators shown on the graph. You may update them while working. [table] from s | from a | from b | from c | from d | from e sa 3/7 | ad 3/6 | bt 6/6 | ct 1/5 | dt 3/8 | eb 3/3 sb 3/6 | | | | | ec 1/3 se 4/4 | | | | | [/table] Marked area below. Answer both parts. Maximum value of an s-t flow: Answer 1 Question 3[input] Vertices on the side of s in the minimum cut: [table] s | a | b | c | d | e [/table] Check Question 3多项填空题
登录即可查看完整答案
我们收录了全球超50000道真实原题与详细解析,现在登录,立即获得答案。
类似问题
Question textmax-flow model: assigning parcels to delivery vans A courier company has several parcels that need to be delivered during the morning shift. Each delivery van can carry up to a certain number of parcels, depending on its size and route. Each parcel can be assigned to at most one van. A van can only carry a parcel if that parcel's destination lies on the van's route. The aim is to assign as many parcels as possible to suitable vans. [table] van | parcels it can deliver a | p2, p4 b | p1, p3 c | p1 [/table] [table] van | maximum number of parcels a | 1 b | 4 c | 3 [/table] The following directed graph shows a max-flow network modelled to assign as many parcels to suitable vans as possible. The source is s and the sink is t. The diagram deliberately shows all possible directed edges from vans to parcels. You may need to give some edges a capacity of 0. For max-flow, this is equivalent to an edge not being in the graph. s a b c p1 p2 p3 p4 t source vans parcels sink For each directed edge below, enter its capacity. [table] edge | capacity s → a | Answer 1 Question 3 s → b | Answer 2 Question 3 s → c | Answer 3 Question 3 a → p1 | Answer 4 Question 3 a → p2 | Answer 5 Question 3 a → p3 | Answer 6 Question 3 a → p4 | Answer 7 Question 3 b → p1 | Answer 8 Question 3 b → p2 | Answer 9 Question 3 b → p3 | Answer 10 Question 3 b → p4 | Answer 11 Question 3 c → p1 | Answer 12 Question 3 c → p2 | Answer 13 Question 3 c → p3 | Answer 14 Question 3 c → p4 | Answer 15 Question 3 p1 → t | Answer 16 Question 3 p2 → t | Answer 17 Question 3 p3 → t | Answer 18 Question 3 p4 → t | Answer 19 Question 3 [/table] Check Question 3
Question text Consider the following circulation with demand flow network.The demand is indicated in each vertex. The lower bound is indicated in blue and the capacity is indicated in black for each edge. The first step is to resolve the lower-bound of every edge, updating the demand of each vertex and the capacity of each edge.Demand for vertex u = Answer 1 Question 1[input] Demand for vertex v = Answer 2 Question 1[input] Demand for vertex w = Answer 3 Question 1[input] Demand for vertex x = Answer 4 Question 1[input] Capacity for edge <u,v> = Answer 5 Question 1[input] Capacity for edge <u,w> = Answer 6 Question 1[input] Capacity for edge <v,w> = Answer 7 Question 1[input] Capacity for edge <x,u> = Answer 8 Question 1[input] Capacity for edge <x,v> = Answer 9 Question 1[input] Then the demand can be resolved by creating a source node and a sink node. The source node is connected to [table] u | v | w | x [/table] and the remaining vertices are connected to the sink node.Then we run Ford-Fulkerson and the flow network is Answer 10 Question 1[select: , Feasible, Not Feasible].
给定以下网络及其容量和流量。 该网络的流量值是多少? 输入一个数字。 Given the following network and its capacity and flow. What is the flow value in the network? Enter a number.
The supply nodes in the graphical representation of the transshipment problem:
更多留学生实用工具
希望你的学习变得更简单
加入我们,立即解锁 海量真题 与 独家解析,让复习快人一步!