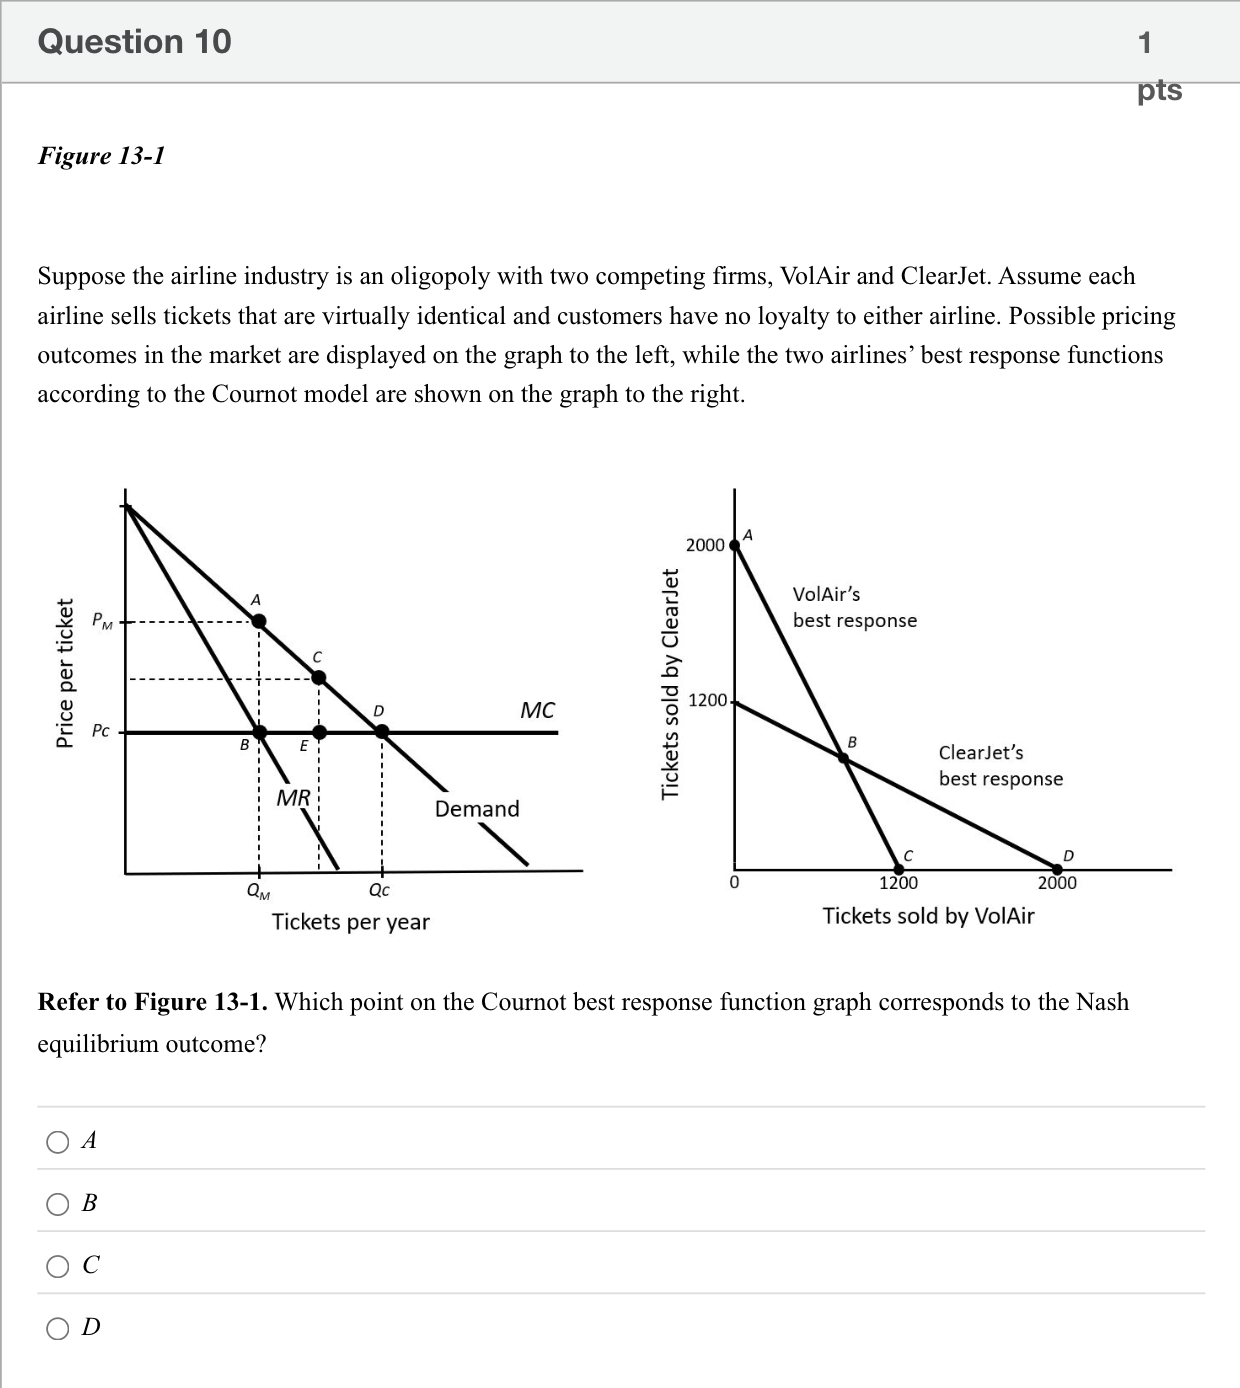
Figure 13-1 Suppose the airline industry is an oligopoly with two competing firms, VolAir and ClearJet. Assume each airline sells tickets that are virtually identical and customers have no loyalty to either airline. Possible pricing outcomes in the market are displayed on the graph to the left, while the two airlines’ best response functions according to the Cournot model are shown on the graph to the right. Refer to Figure 13-1. Which point on the Cournot best response function graph corresponds to the Nash equilibrium outcome?单项选择题
A
A
B
B
C
C
D
D
登录即可查看完整答案
我们收录了全球超50000道真实原题与详细解析,现在登录,立即获得答案。
类似问题
Refer to figure 6: A single fishing firm and the rest of the fishing industry simultaneously choose how intensively to fish in a shared fishery. Higher fishing effort raises short‑run profits for each player but reduces the overall fish stock, affecting the profits of others. Refer to fig 6 above and select the correct statement:
In a non-cooperative, imperfect information, simultaneous-choice, one-period game, a Nash equilibrium
The above figure shows the payoff to two airlines, A and B, of serving a particular route. If the two airlines must decide simultaneously, what is the Nash equilibrium?
Question 4.82 Choose the correct answerRead the following statements about dominant strategies and select the correct one.
更多留学生实用工具
希望你的学习变得更简单
加入我们,立即解锁 海量真题 与 独家解析,让复习快人一步!