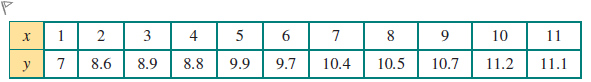
The following data were collected for two related variables x and y. A scatterplot indicates a non-linear association. The data is linearised using a logx transformation and a least squares line is then fitted. The equation of this line isclosest to:单项选择题
A
a. y = 7.04 + 3.86 log x
B
b. y = −1.71 + 0.25 log x
C
c. y = 0.37 + 7.52 log x
D
d. y = 7.52 + 0.37 log x
登录即可查看完整答案
我们收录了全球超50000道真实原题与详细解析,现在登录,立即获得答案。
类似问题
Consider the following estimated regression model [math: ln(yi)^=0.034−0.023xi]\widehat {\ln (y_i)}=0.034-0.023x_i where [math: ln(.)]\ln (.) denotes the natural log. Which of the following is a correct interpretation?[Fill in the blank]
An exponential model with a quarterly data forecasting equation is log( ˆ Y i)=2.0886+0.0016Xi−0.0528Q1−0.0389Q2−0.0449Q3 Where Xi represents the coded quarter, Qi is a dummy variable for quarters, Qi=1 if it is ith quarter. What is the prediction when Xi=27, and it is the fourth quarter?
The following data were collected for two related variables x and y. A scatterplot indicates a non-linear association. The data is linearised using a logx transformation and a least squares line is then fitted. The equation of this line isclosest to:
Read Example 7.9 on page 233 carefully. Consider the following sample regression function: log ( 𝑤 𝑎 𝑔 𝑒 ) ^ = 𝛽 ^ 0 + .2 𝑐 𝑜 𝑚 𝑝 𝑤 𝑜 𝑟 𝑘 + .05 𝑐 𝑜 𝑚 𝑝 ℎ 𝑜 𝑚 𝑒 + .03 𝑐 𝑜 𝑚 𝑝 𝑤 𝑜 𝑟 𝑘 ⋅ 𝑐 𝑜 𝑚 𝑝 ℎ 𝑜 𝑚 𝑒 + 𝑜 𝑡 ℎ 𝑒 𝑟 𝑓 𝑎 𝑐 𝑡 𝑜 𝑟 𝑠 ( .01 ) ( .02 ) ( .005 ) where the variables wage, compwork, and comphome are defined respectively as hourly wage, = 1 if an individual uses a computer at work, and = 1 if an individual uses a computer at home. Which of the following statements is correct?
更多留学生实用工具
希望你的学习变得更简单
加入我们,立即解锁 海量真题 与 独家解析,让复习快人一步!