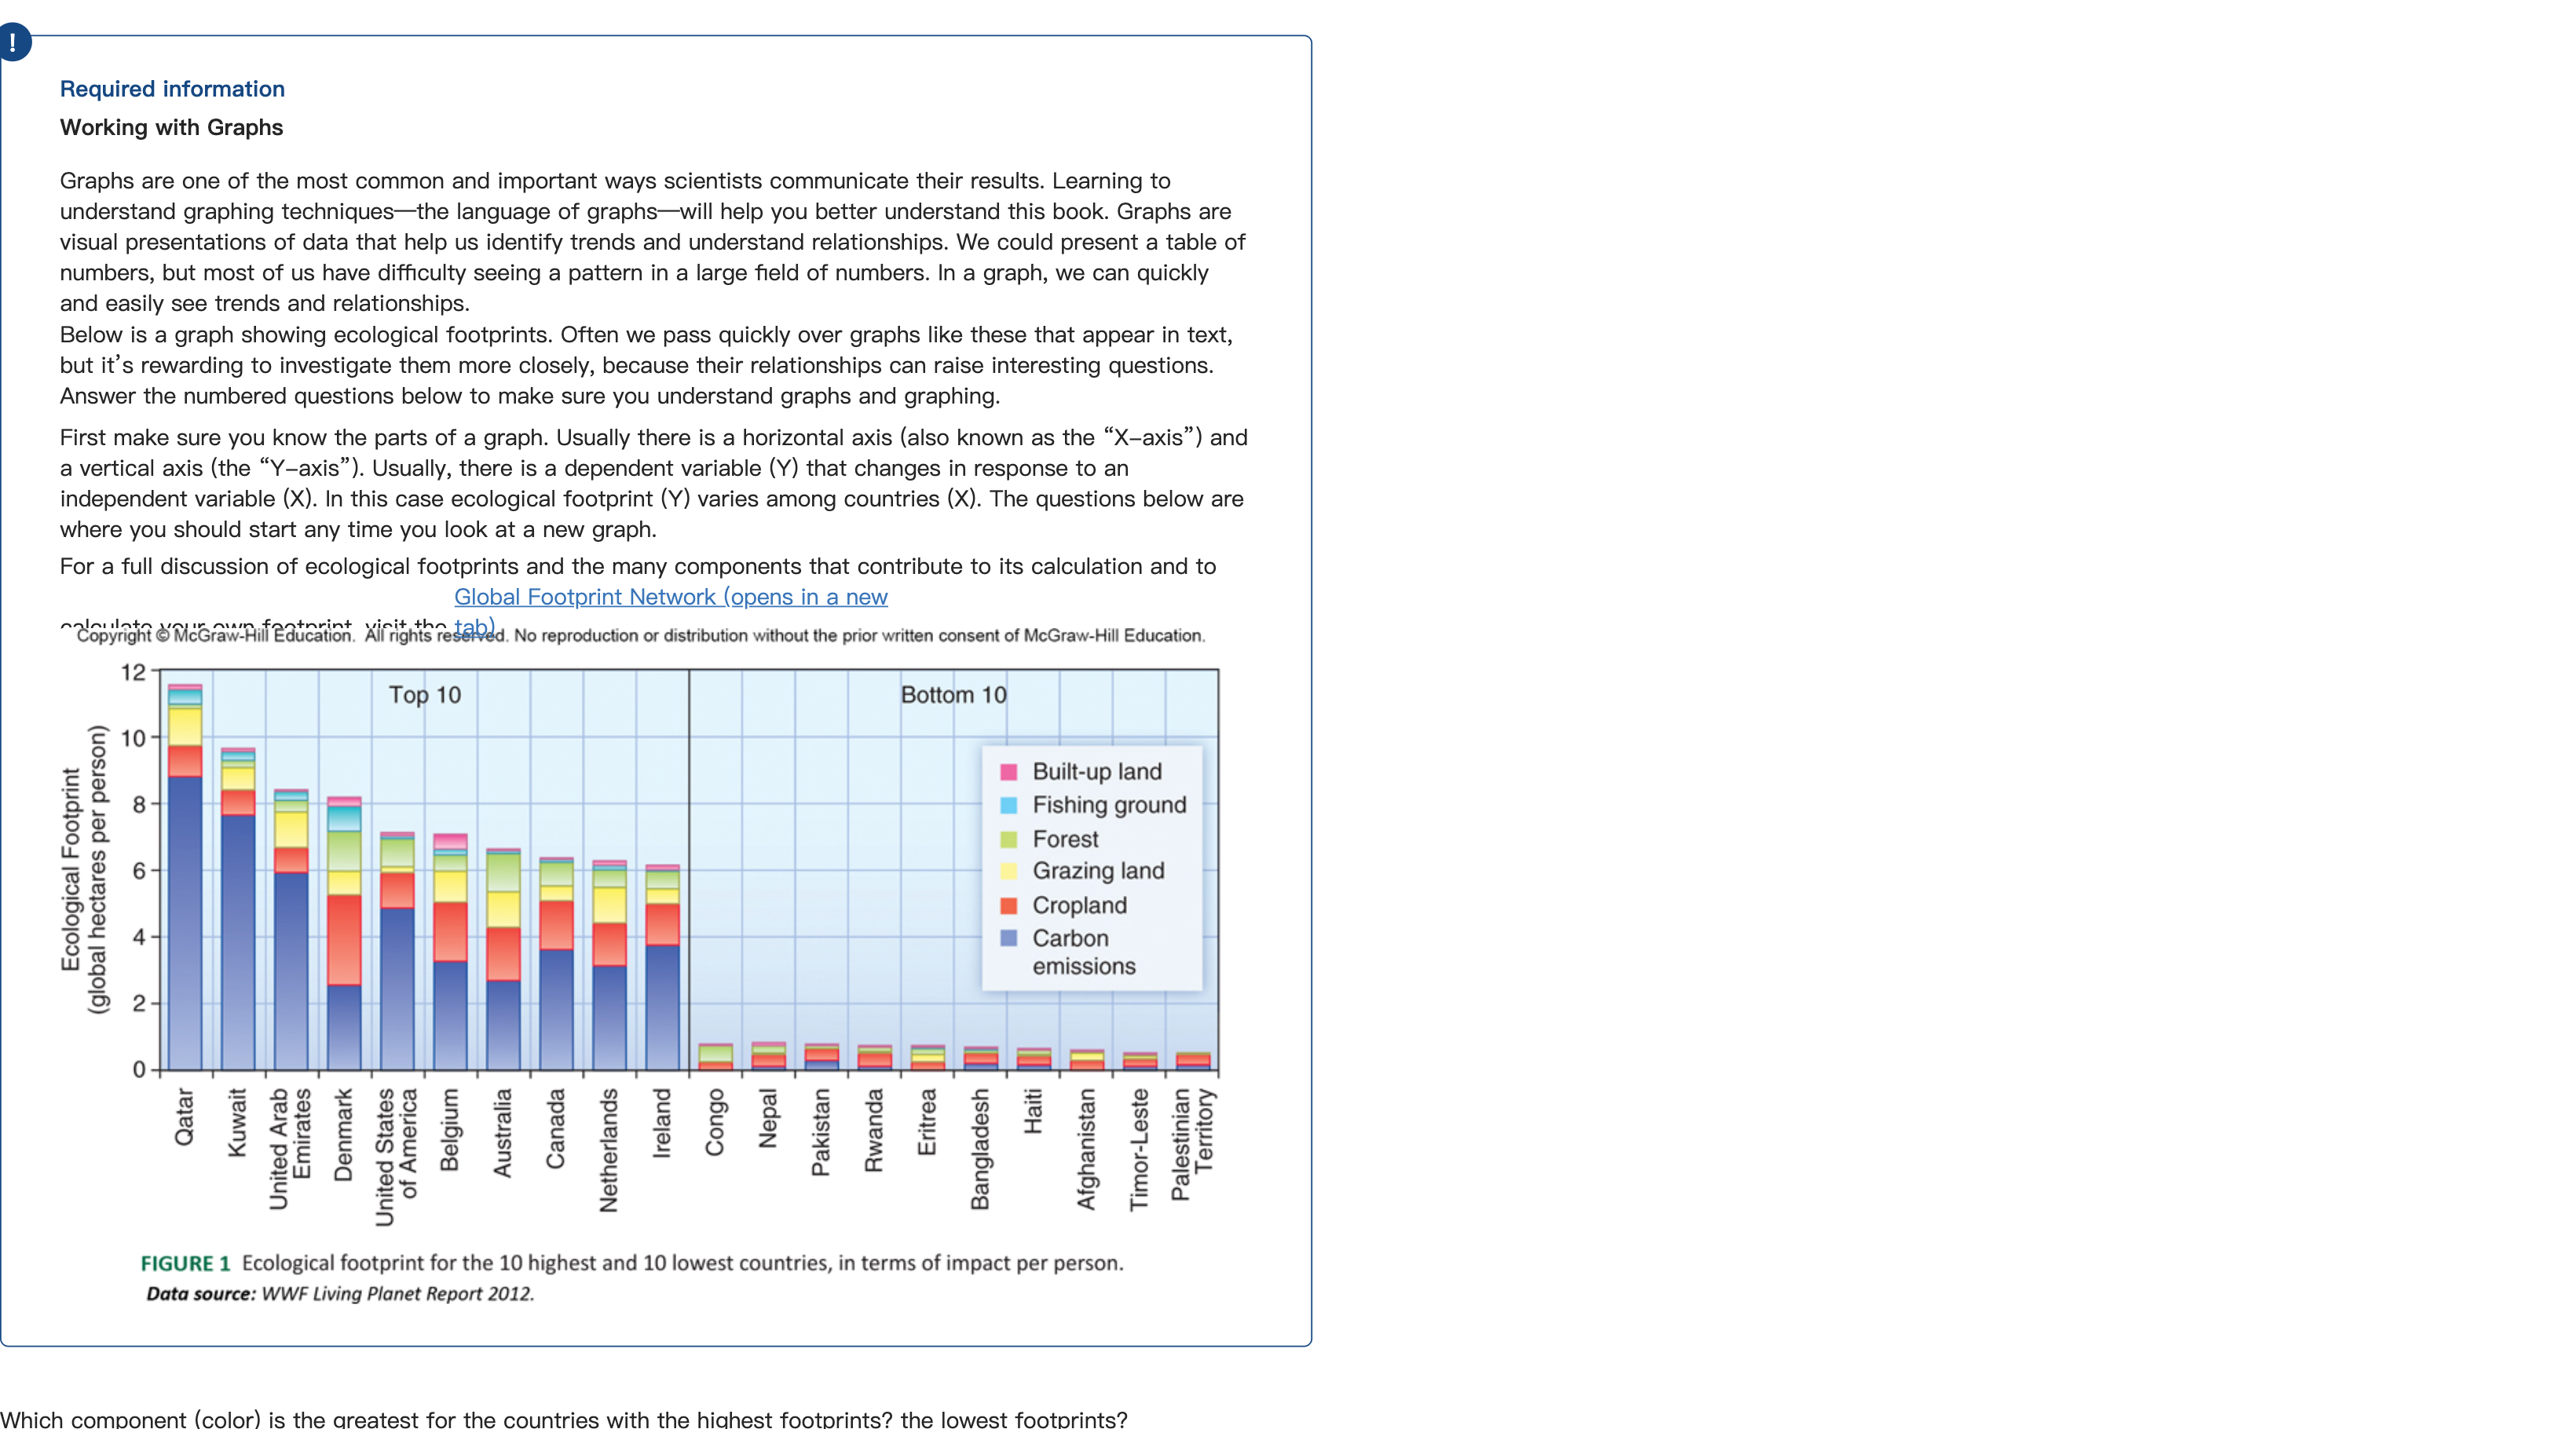
Required information Skip to question Working with Graphs Graphs are one of the most common and important ways scientists communicate their results. Learning to understand graphing techniques—the language of graphs—will help you better understand this book. Graphs are visual presentations of data that help us identify trends and understand relationships. We could present a table of numbers, but most of us have difficulty seeing a pattern in a large field of numbers. In a graph, we can quickly and easily see trends and relationships. Below is a graph showing ecological footprints. Often we pass quickly over graphs like these that appear in text, but it’s rewarding to investigate them more closely, because their relationships can raise interesting questions. Answer the numbered questions below to make sure you understand graphs and graphing. First make sure you know the parts of a graph. Usually there is a horizontal axis (also known as the “X-axis”) and a vertical axis (the “Y-axis”). Usually, there is a dependent variable (Y) that changes in response to an independent variable (X). In this case ecological footprint (Y) varies among countries (X). The questions below are where you should start any time you look at a new graph. For a full discussion of ecological footprints and the many components that contribute to its calculation and to calculate your own footprint, visit the Global Footprint Network (opens in a new tab). "The horizontal axis represents countries, while the vertical axis represents ecological footprint ranging from 0 through 12 in increments of 2.The data is as follows:Top 10:Qatar: Carbon emissions: 8.4; Cropland: 1.1; grazing land: 1.5; forest: 0.2; fishing ground: 0.4; and built-up land: 0.2.Kuwait:Carbon emissions: 7.8; Cropland: 8.3; grazing land: 0.7; forest: 0.3; fishing ground: 0.3; and built-up land: 0.2.United Arab Emirates:Carbon emissions: 5.9; Cropland: 0.5; grazing land: 1.4; forest: 0.4; fishing ground: 0.3; and built-up land: 0.1.Denmark:Carbon emissions: 2.4; Cropland: 2.9; grazing land: 0.7; forest: 1.2; fishing ground: 0.7; and built-up land: 0.2.United States of America: Carbon emissions: 5; Cropland: 0.9; grazing land: 0.2; forest: 1; fishing ground: 0.1; and built-up land: 0.1.Belgium:Carbon emissions: 3.2; Cropland: 1.8; grazing land: 0.9; forest: 0.4; fishing ground: 0.2; and built-up land: 0.3.Australia:Carbon emissions: 2.6; Cropland: 1.6; grazing land: 1; forest: 0.8; fishing ground: 0.1; and built-up land: 0.1.Canada:Carbon emissions: 3.7; Cropland: 1.3; grazing land: 0.3; forest: 0.4; fishing ground: 0.1; and built-up land: 0.1.Netherlands:Carbon emissions: 3; Cropland: 1.3; grazing land: 1.2; forest: 0.5; fishing ground: 0.1; and built-up land: 0.1.Ireland:Carbon emissions: 3.8; Cropland: 1.2; grazing land: 0.2; forest: 0.3; fishing ground: 0.1; and built-up land: 0.1.Bottom 10:Congo:Cropland: 0.2; grazing land: 0.4; and built-up land: 0.1.Nepal:Carbon emissions: 0.1; Cropland: 0.3; forest: 0.1; and built-up land: 0.1.Pakistan:Carbon emissions: 0.2; Cropland: 0.2; forest: 0.1; and built-up land: 0.1.Rwanda:Carbon emissions: 0.1; Cropland: 0.3; forest: 0.1; and built-up land: 0.1.Eritrea:Cropland: 0.2; grazing land: 0.2; forest land: 0.2; fishing ground: 0.1; and built-up land: 0.1.Bangladesh:Carbon emissions: 0.2; Cropland: 0.2; forest: 0.1; fishing ground: 0.1; and built-up land: 0.1.Haiti:Carbon emissions: 0.1; Cropland: 0.1; forest: 0.1; and built-up land: 0.1.Afghanistan:Cropland: 0.2; grazing land: 0.2; and built-up land: 0.1.Timor-Leste:Carbon emissions: 0.1; Cropland: 0.2; forest: 0.1; and built-up land: 0.1.Palestinian territory:Carbon emissions: 0.1; Cropland: 0.2; and forest: 0.1.Note: All data is approximate." Which component (color) is the greatest for the countries with the highest footprints? the lowest footprints?单项选择题
A
cropland, cropland
B
carbon emissions, cropland
C
carbon emissions, forest
D
cropland, carbon emissions
登录即可查看完整答案
我们收录了全球超50000道真实原题与详细解析,现在登录,立即获得答案。
类似问题
Required information Skip to question Working with Graphs Graphs are one of the most common and important ways scientists communicate their results. Learning to understand graphing techniques—the language of graphs—will help you better understand this book. Graphs are visual presentations of data that help us identify trends and understand relationships. We could present a table of numbers, but most of us have difficulty seeing a pattern in a large field of numbers. In a graph, we can quickly and easily see trends and relationships. Below is a graph showing ecological footprints. Often we pass quickly over graphs like these that appear in text, but it’s rewarding to investigate them more closely, because their relationships can raise interesting questions. Answer the numbered questions below to make sure you understand graphs and graphing. First make sure you know the parts of a graph. Usually there is a horizontal axis (also known as the “X-axis”) and a vertical axis (the “Y-axis”). Usually, there is a dependent variable (Y) that changes in response to an independent variable (X). In this case ecological footprint (Y) varies among countries (X). The questions below are where you should start any time you look at a new graph. For a full discussion of ecological footprints and the many components that contribute to its calculation and to calculate your own footprint, visit the Global Footprint Network (opens in a new tab). "The horizontal axis represents countries, while the vertical axis represents ecological footprint ranging from 0 through 12 in increments of 2.The data is as follows:Top 10:Qatar: Carbon emissions: 8.4; Cropland: 1.1; grazing land: 1.5; forest: 0.2; fishing ground: 0.4; and built-up land: 0.2.Kuwait:Carbon emissions: 7.8; Cropland: 8.3; grazing land: 0.7; forest: 0.3; fishing ground: 0.3; and built-up land: 0.2.United Arab Emirates:Carbon emissions: 5.9; Cropland: 0.5; grazing land: 1.4; forest: 0.4; fishing ground: 0.3; and built-up land: 0.1.Denmark:Carbon emissions: 2.4; Cropland: 2.9; grazing land: 0.7; forest: 1.2; fishing ground: 0.7; and built-up land: 0.2.United States of America: Carbon emissions: 5; Cropland: 0.9; grazing land: 0.2; forest: 1; fishing ground: 0.1; and built-up land: 0.1.Belgium:Carbon emissions: 3.2; Cropland: 1.8; grazing land: 0.9; forest: 0.4; fishing ground: 0.2; and built-up land: 0.3.Australia:Carbon emissions: 2.6; Cropland: 1.6; grazing land: 1; forest: 0.8; fishing ground: 0.1; and built-up land: 0.1.Canada:Carbon emissions: 3.7; Cropland: 1.3; grazing land: 0.3; forest: 0.4; fishing ground: 0.1; and built-up land: 0.1.Netherlands:Carbon emissions: 3; Cropland: 1.3; grazing land: 1.2; forest: 0.5; fishing ground: 0.1; and built-up land: 0.1.Ireland:Carbon emissions: 3.8; Cropland: 1.2; grazing land: 0.2; forest: 0.3; fishing ground: 0.1; and built-up land: 0.1.Bottom 10:Congo:Cropland: 0.2; grazing land: 0.4; and built-up land: 0.1.Nepal:Carbon emissions: 0.1; Cropland: 0.3; forest: 0.1; and built-up land: 0.1.Pakistan:Carbon emissions: 0.2; Cropland: 0.2; forest: 0.1; and built-up land: 0.1.Rwanda:Carbon emissions: 0.1; Cropland: 0.3; forest: 0.1; and built-up land: 0.1.Eritrea:Cropland: 0.2; grazing land: 0.2; forest land: 0.2; fishing ground: 0.1; and built-up land: 0.1.Bangladesh:Carbon emissions: 0.2; Cropland: 0.2; forest: 0.1; fishing ground: 0.1; and built-up land: 0.1.Haiti:Carbon emissions: 0.1; Cropland: 0.1; forest: 0.1; and built-up land: 0.1.Afghanistan:Cropland: 0.2; grazing land: 0.2; and built-up land: 0.1.Timor-Leste:Carbon emissions: 0.1; Cropland: 0.2; forest: 0.1; and built-up land: 0.1.Palestinian territory:Carbon emissions: 0.1; Cropland: 0.2; and forest: 0.1.Note: All data is approximate." Approximately what proportion of the total footprint for the United States is represented by croplands?
The implementation and loading phase of the Database Life Cycle (DBLC) involves _____.
Question textComplete the following protocol table for setting up your standard curve for protein. Remember, each of your standards, except the reagent blank, will be prepared in duplicate in the lab (i..e, you will make up each of these standards twice), giving you 11 standards. When filling in your answers, be careful with your formatting and note the following requirements: for all entries of concentrations, volumes and amounts in this table, include two decimal places (e.g. '1.5') for any decimal numbers less than one, make sure you precede the decimal point with the number zero (i.e. type in '0.2'; not '.2' without the zero) [table] Standard | Concentration of BSA standard | Volume of 20 mg/mL BSA stock solution required (mL) | Volume of 0.05 M NaOH diluent required (mL) | Amount of BSA present (mg) | Volume (mL) 1(reagent blank) | 0 | Answer 1 Question 6 | Answer 2 Question 6 | Answer 3 Question 6 | 0.8 2 | 4 | Answer 4 Question 6 | Answer 5 Question 6 | Answer 6 Question 6 | 0.8 3 | 8 | Answer 7 Question 6 | Answer 8 Question 6 | Answer 9 Question 6 | 0.8 4 | 12 | Answer 10 Question 6 | Answer 11 Question 6 | Answer 12 Question 6 | 0.8 5 | 16 | Answer 13 Question 6 | Answer 14 Question 6 | Answer 15 Question 6 | 0.8 6 | 20 | Answer 16 Question 6 | Answer 17 Question 6 | Answer 18 Question 6 | 0.8 [/table]
Which of the following parameters is used to determine the concentration of protein in a spectrophotometer?
更多留学生实用工具
希望你的学习变得更简单
加入我们,立即解锁 海量真题 与 独家解析,让复习快人一步!