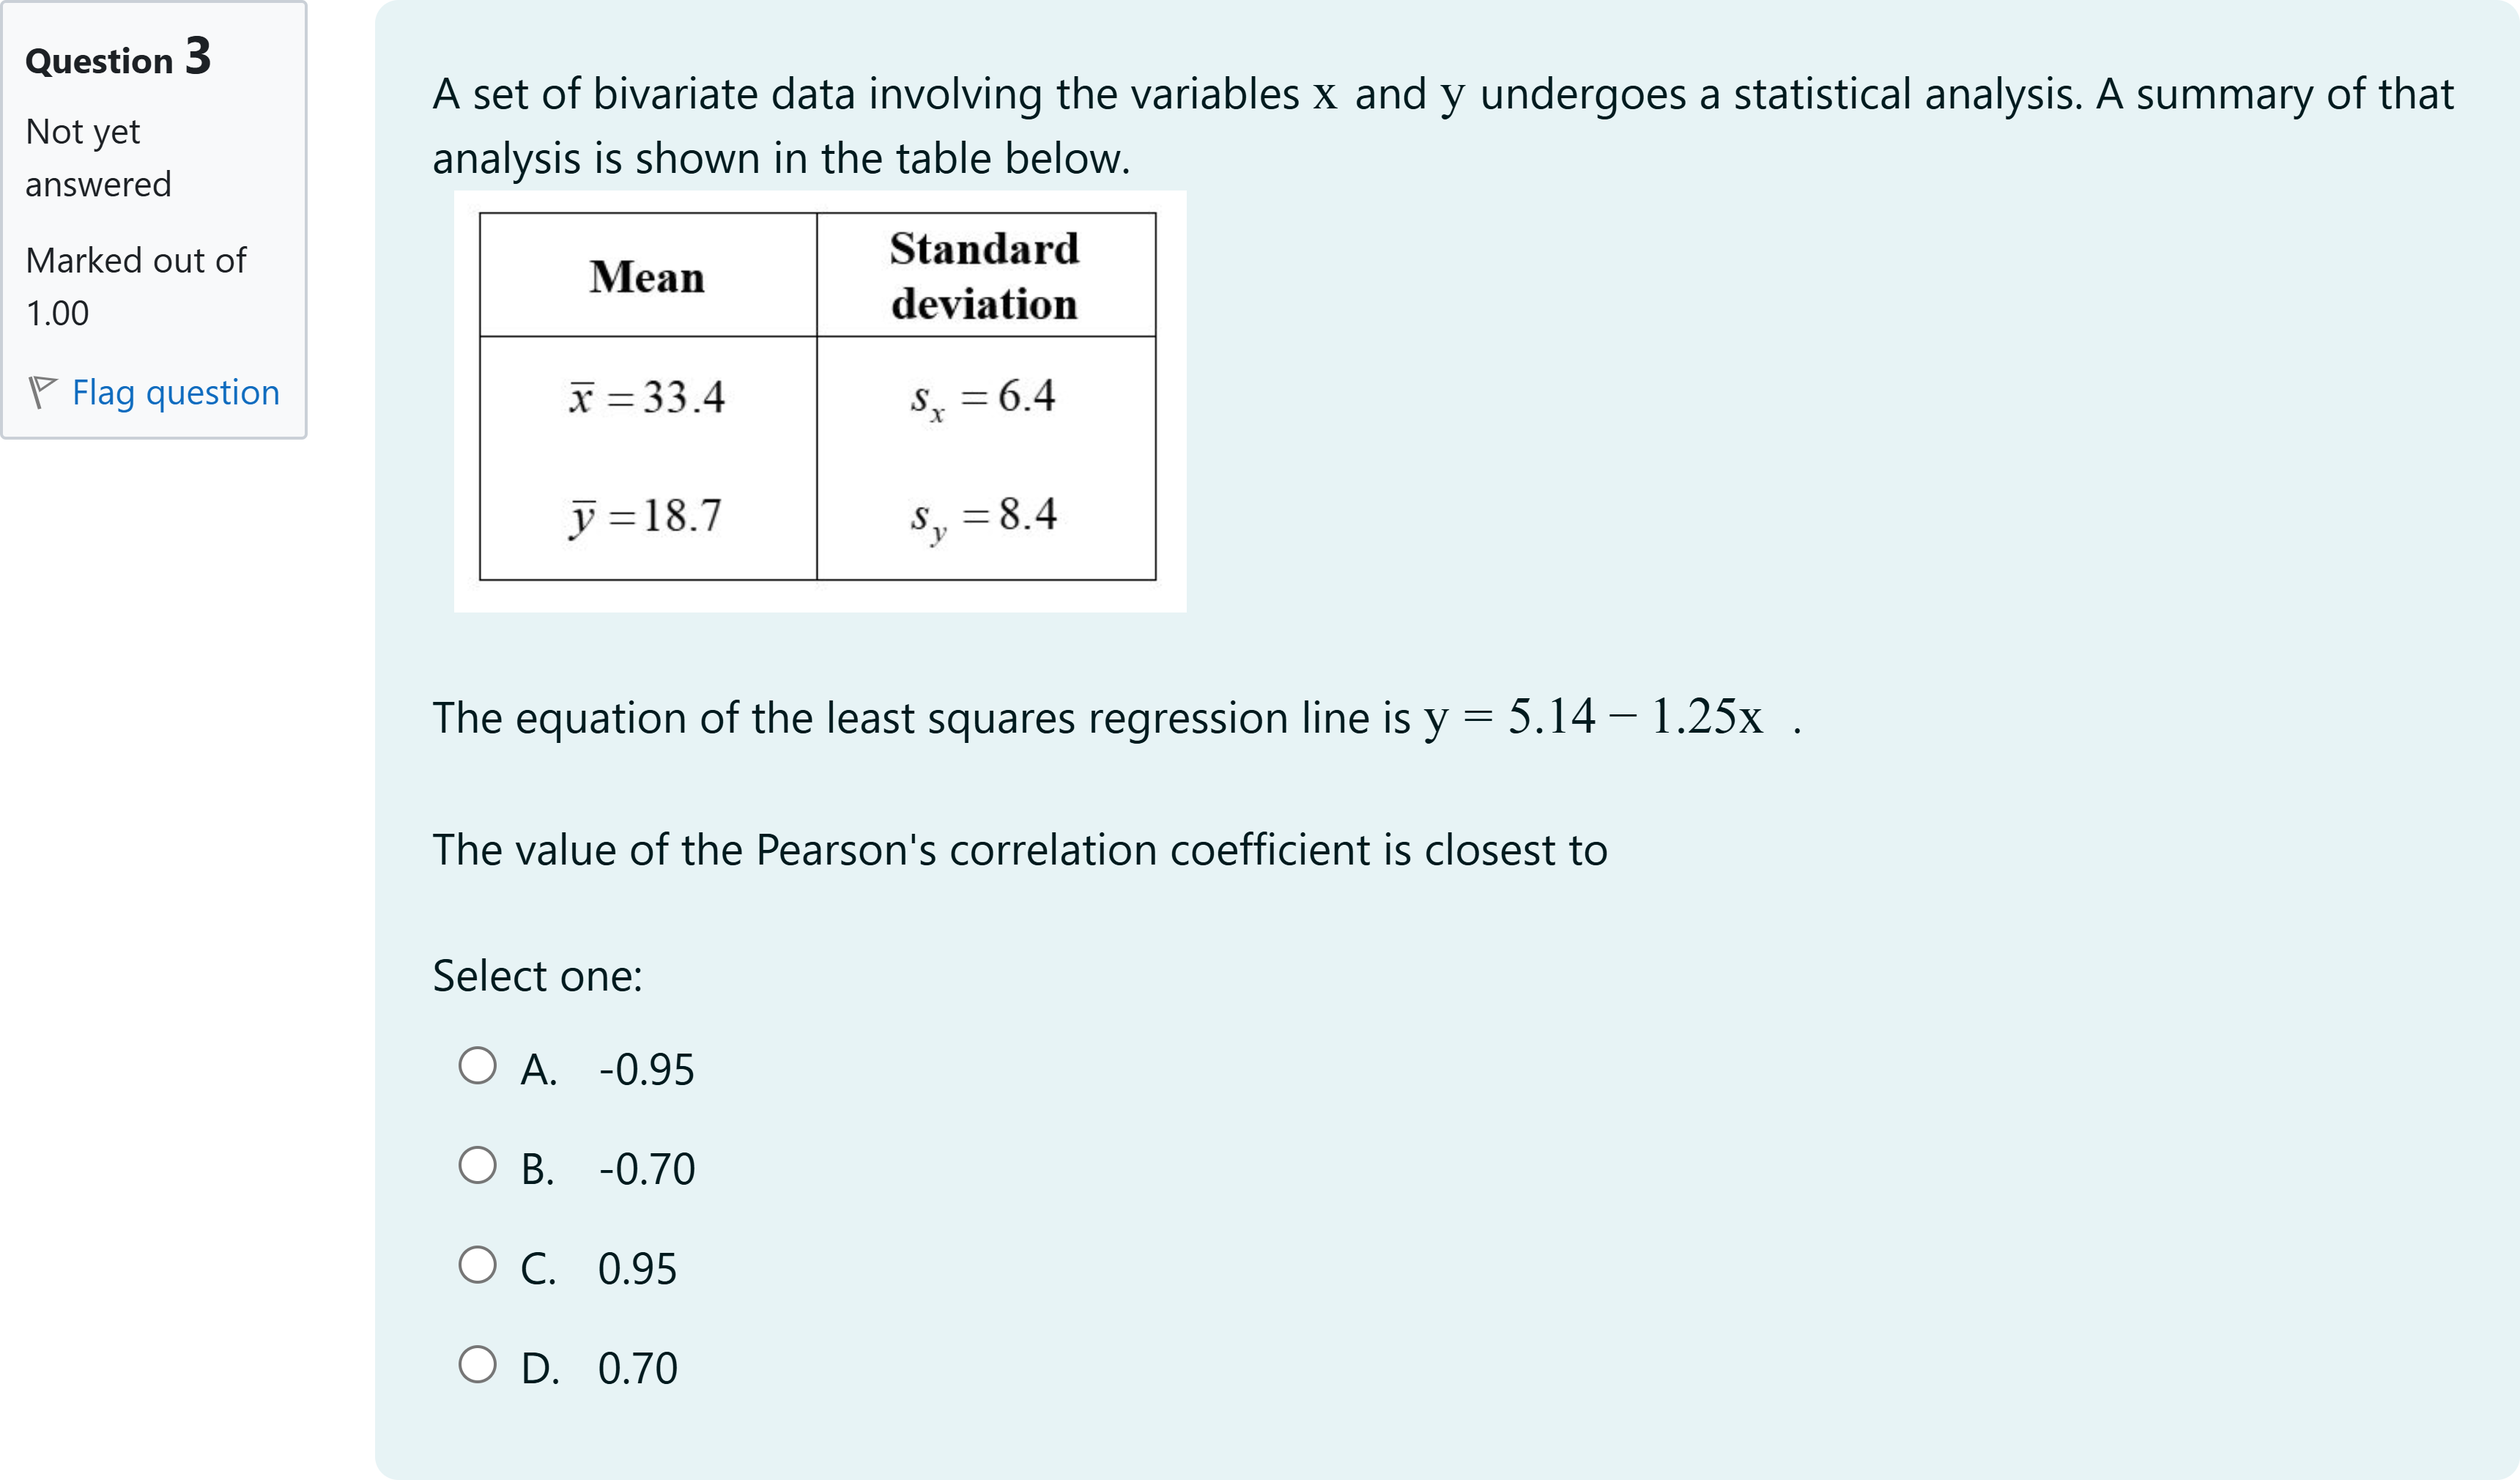
A set of bivariate data involving the variables [math: x] and [math: y] undergoes a statistical analysis. A summary of that analysis is shown in the table below.The equation of the least squares regression line is [math: y=5.14−1.25x].The value of the Pearson's correlation coefficient is closest toSingle choice
A
A. -0.95
B
B. -0.70
C
C. 0.95
D
D. 0.70
Log in for full answers
We've collected over 50,000 authentic original questions and detailed explanations from around the globe. Log in now and get instant access to the answers!
Similar Questions
The value of the theoretical reliability coefficient can vary between:
The birth weight and weight at age 21 of eight women are given in the table below. [table] Birth weight (kg) | 1.9 | 2.4 | 2.6 | 2.7 | 2.9 | 3.2 | 3.4 | 3.6 Weight at 21 (kg) | 47.6 | 53.1 | 52.2 | 56.2 | 57.6 | 59.9 | 55.3 | 56.7 [/table] The value of the correlation coefficient is closest to:
The scatterplot below represents percent of lean body mass and resting pulse rate. Is there a linear relationship visible? If so, what would you expect the correlation coefficient to be?
The birth weight and weight at age 21 of eight women are given in the table below. The value of the correlation coefficient is closest to:
More Practical Tools for Students Powered by AI Study Helper
Making Your Study Simpler
Join us and instantly unlock extensive past papers & exclusive solutions to get a head start on your studies!