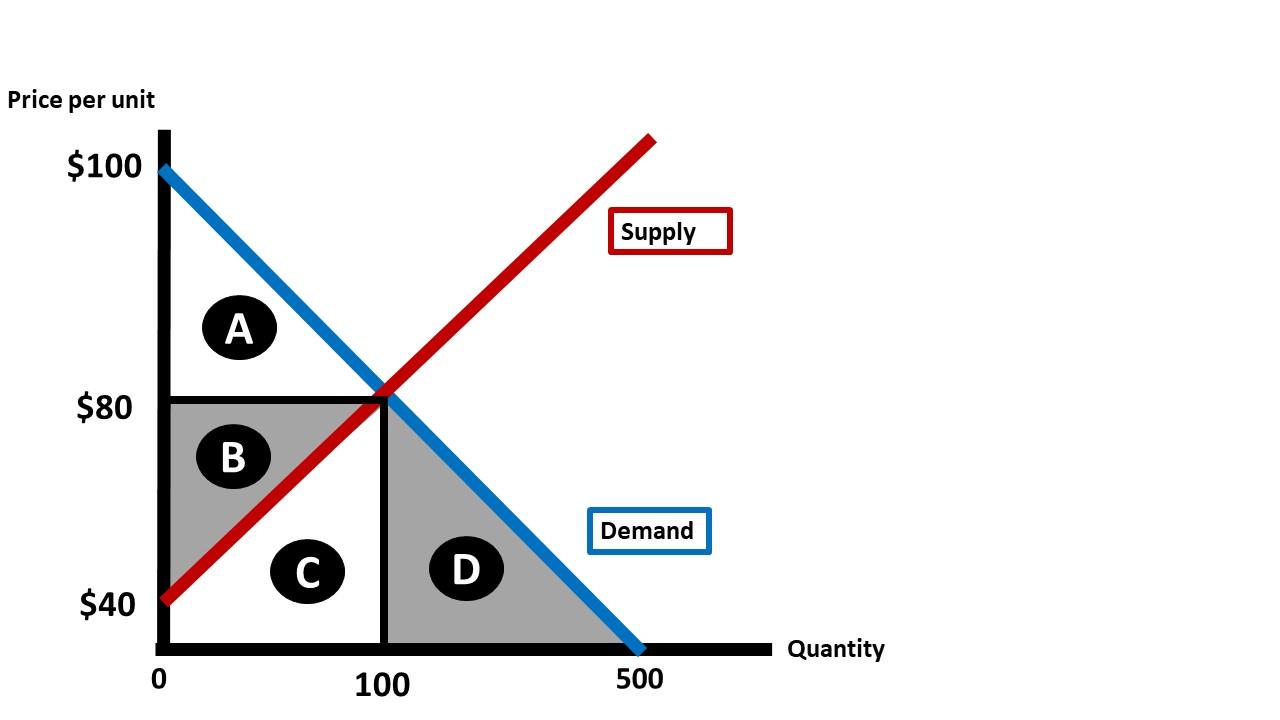
Question at position 5 The graph above shows the demand and supply of vacuum cleaners. The demand for vacuum cleaners is given by: QD = 500 - 5 P. The inverse demand for vacuum cleaners is: P = 100 - 0.2QD. The supply of vacuum cleaners is given by: QS = 2.5P - 100. The inverse supply for vacuum cleaners is: P = 40 + 0.4QS. Which of the area(s) in the graph above represents Gains from Trade? Hint: Gains from trade represent the sum of the benefits to demanders and suppliers.Area AArea BArea A plus Area BArea DArea C单项选择题
A
Area A
B
Area B
C
Area A plus Area B
D
Area D
E
Area C
登录即可查看完整答案
我们收录了全球超50000道真实原题与详细解析,现在登录,立即获得答案。
类似问题
The sum of consumer surplus and producer surplus is equal to
According to the lecture, economic welfare or value created represents:
Consider a perfectly competitive market at equilibrium. The equilibrium price defines
Amanda buys a ruby for $330 for which she was willing to pay $340. The minimum acceptable price to the seller, Tony, was $140. Tony experiences a
更多留学生实用工具
希望你的学习变得更简单
加入我们,立即解锁 海量真题 与 独家解析,让复习快人一步!