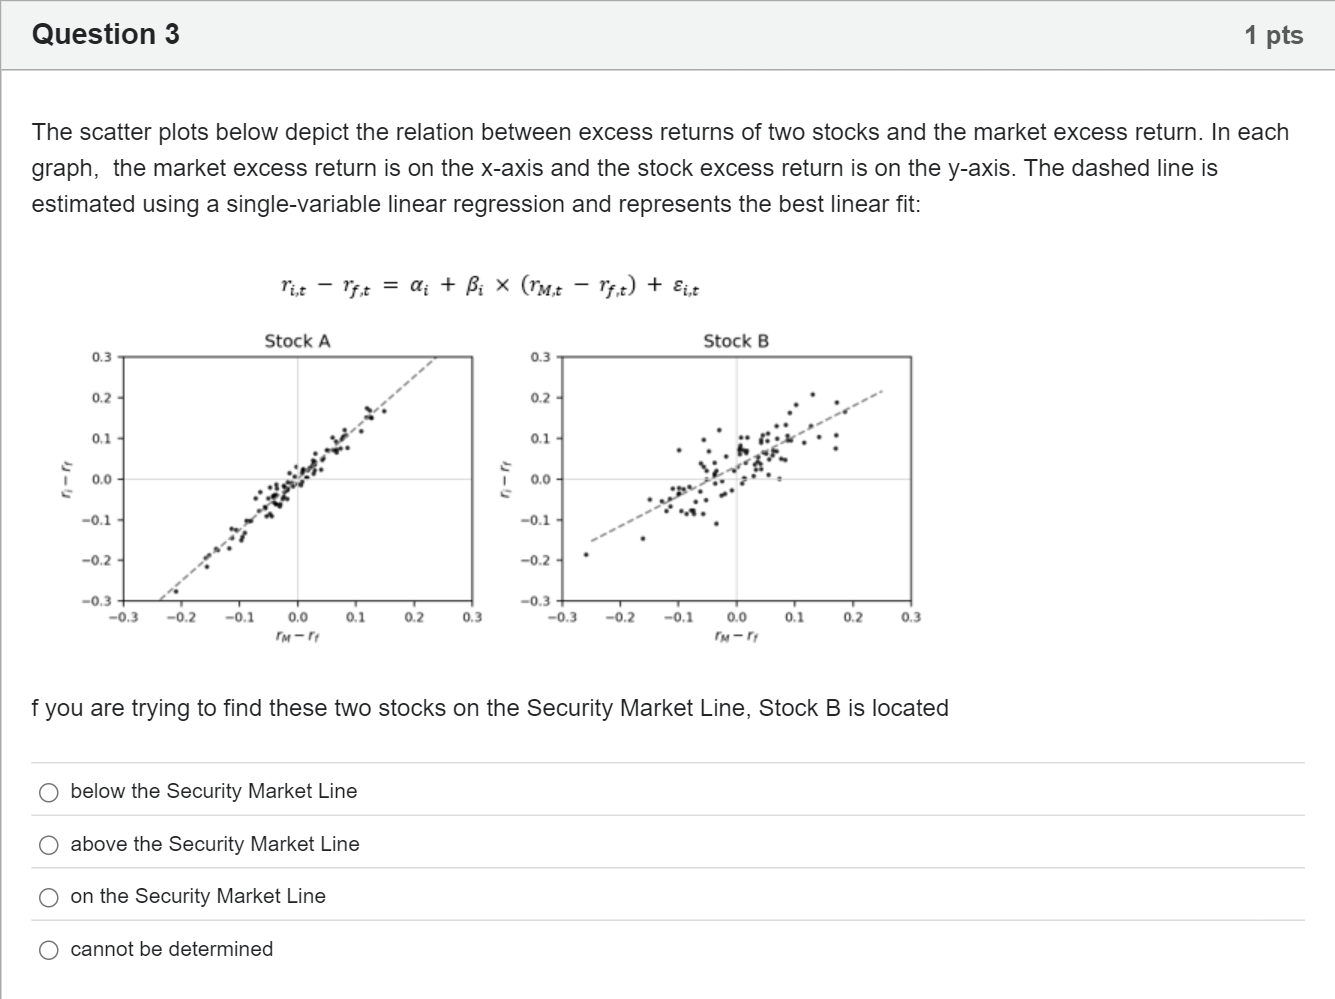
The scatter plots below depict the relation between excess returns of two stocks and the market excess return. In each graph, the market excess return is on the x-axis and the stock excess return is on the y-axis. The dashed line is estimated using a single-variable linear regression and represents the best linear fit: f you are trying to find these two stocks on the Security Market Line, Stock B is located单项选择题
A
below the Security Market Line
B
above the Security Market Line
C
on the Security Market Line
D
cannot be determined
登录即可查看完整答案
我们收录了全球超50000道真实原题与详细解析,现在登录,立即获得答案。
类似问题
For stock A, we have 𝛽 𝑖 = 0.70. Suppose the expected market risk premium next year is 9% and the risk-free rate is 3%. What is the expected return of this stock based on the CAPM? (Please answer in % and round to 2 decimal places. If the answer is 8.057%, then in the box, write 8.06)
The following graph shows the Security Market Line in the current economy. If a stock has a β of 1.2, what is the expected return of this stock based on the CAPM? (Please answer in % and round to 2 decimal places. If the answer is 8.057%, then in the box, write 8.06)
Which of the following is an implication of the CAPM in equilibrium?
According to the CAPM, the key determinant of a stock’s expected return is
更多留学生实用工具
希望你的学习变得更简单
加入我们,立即解锁 海量真题 与 独家解析,让复习快人一步!