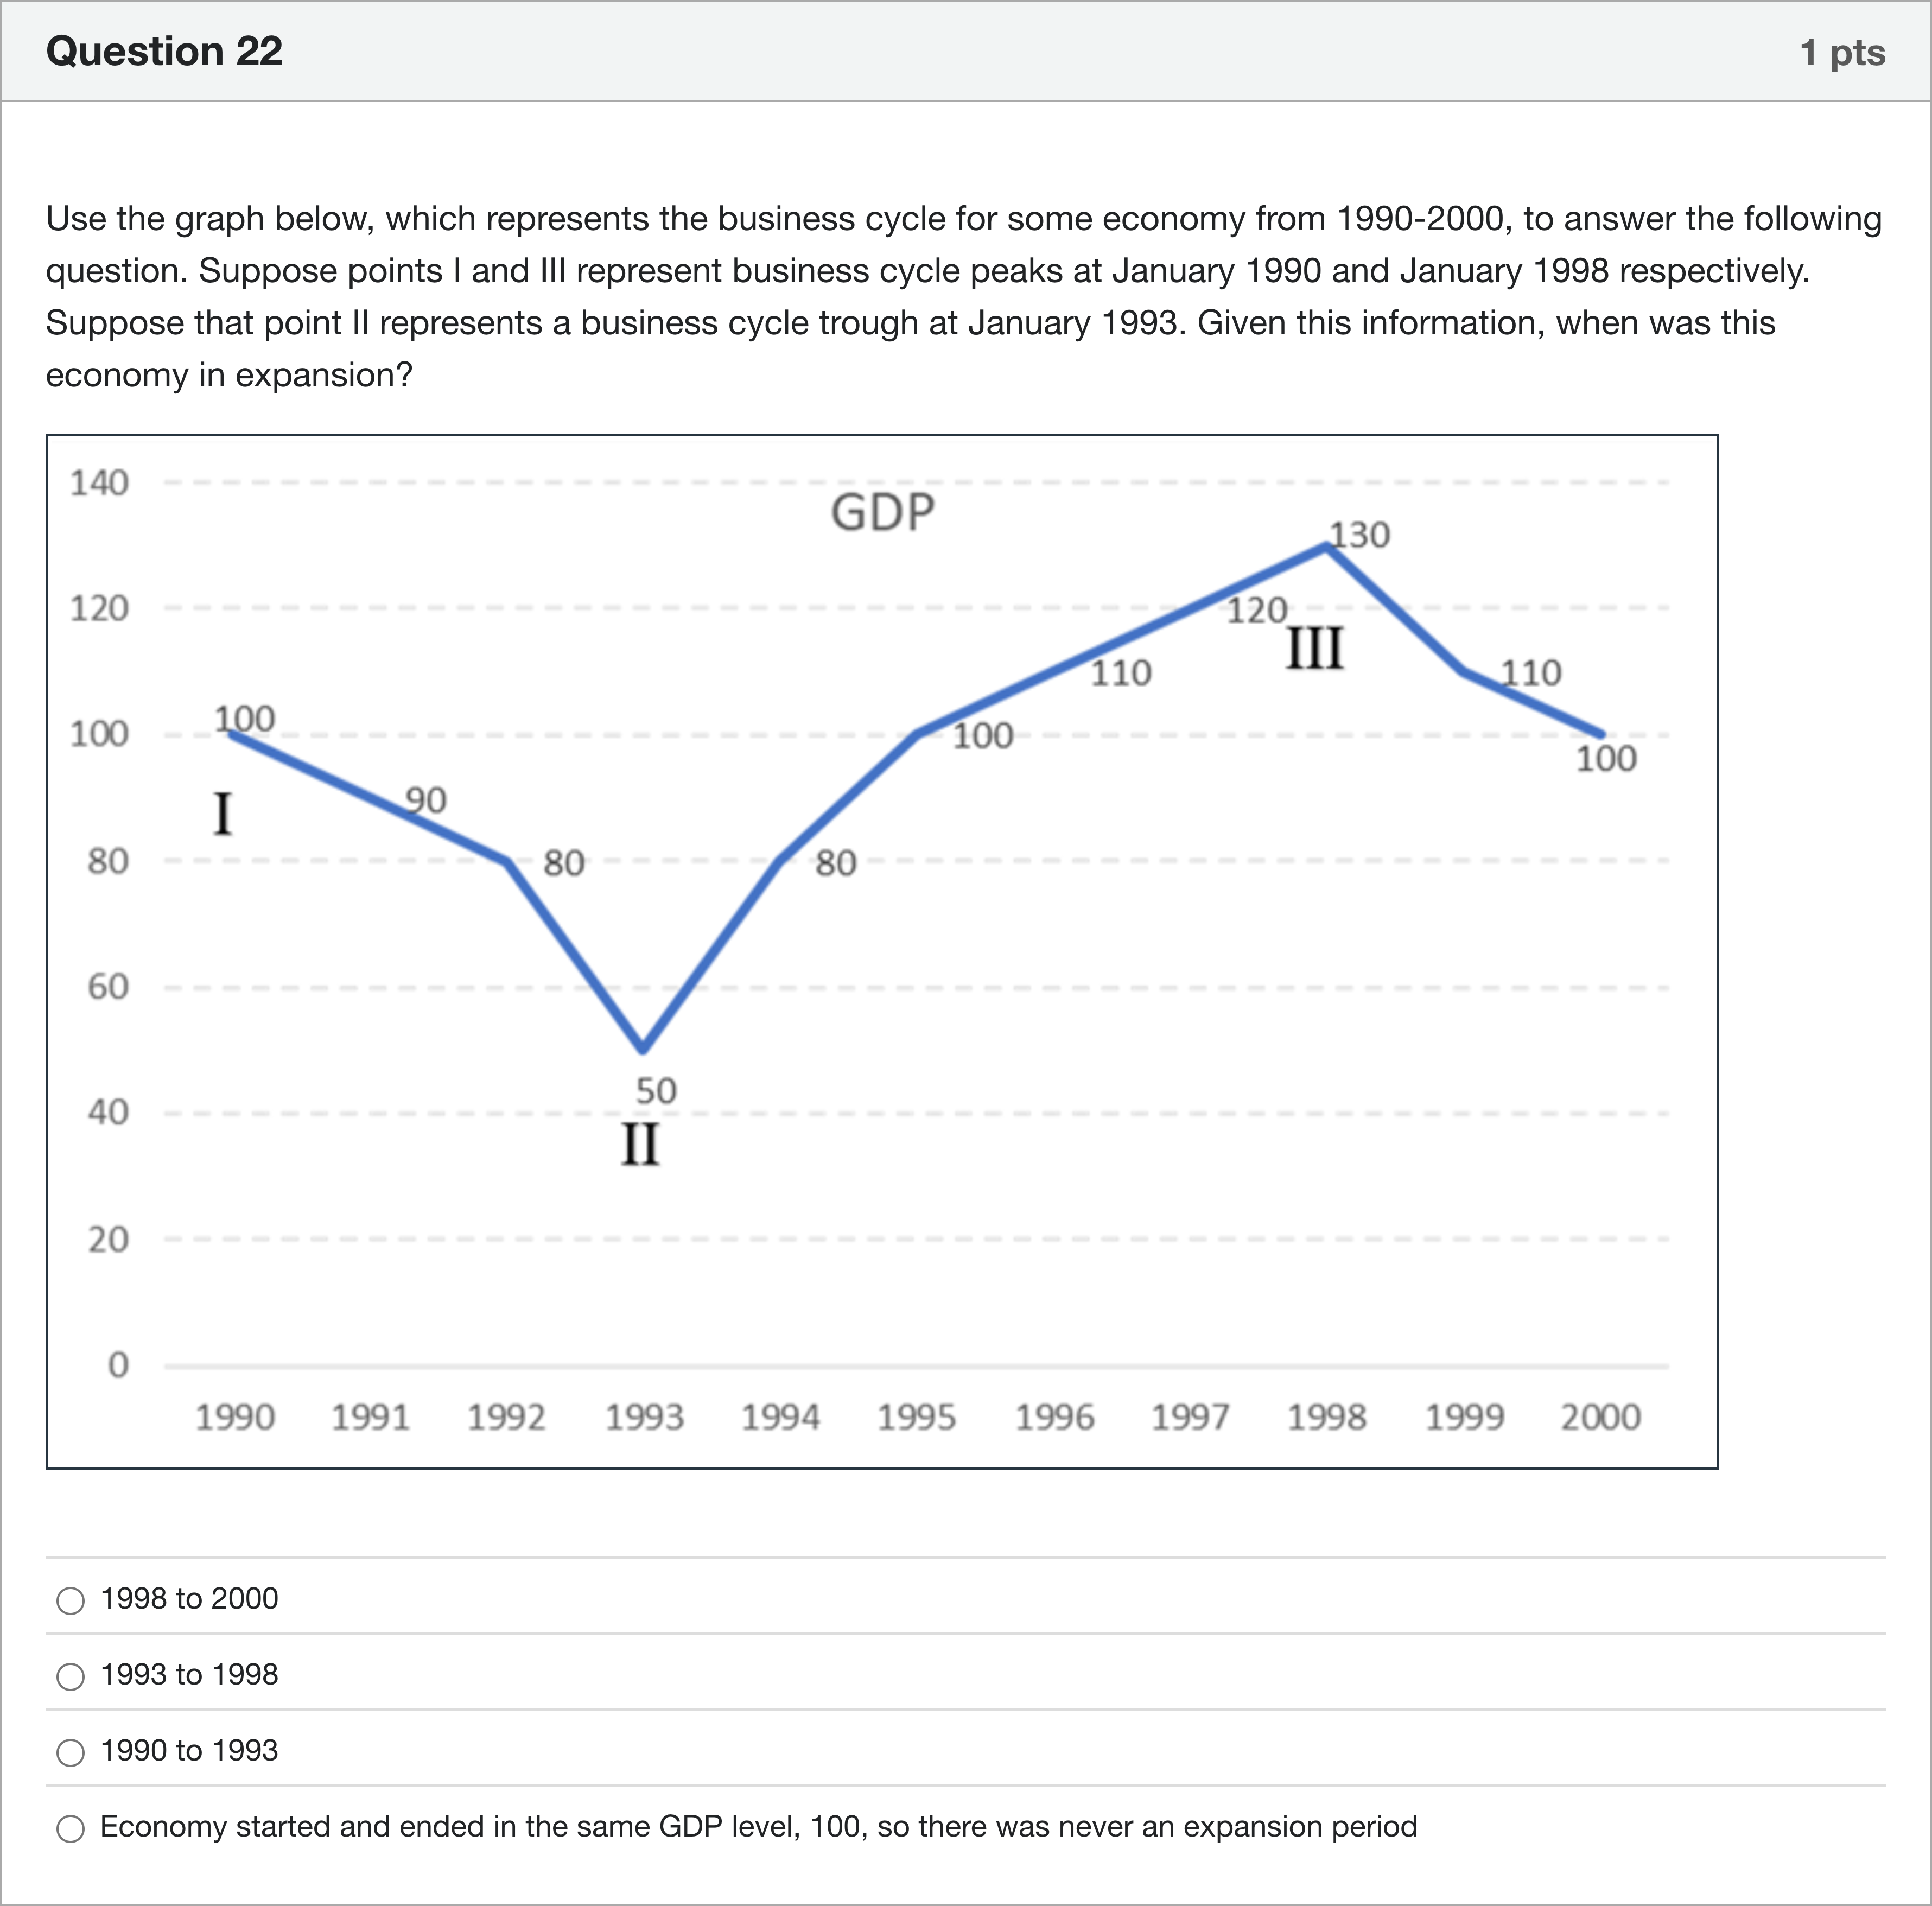
Use the graph below, which represents the business cycle for some economy from 1990-2000, to answer the following question. Suppose points I and III represent business cycle peaks at January 1990 and January 1998 respectively. Suppose that point II represents a business cycle trough at January 1993. Given this information, when was this economy in expansion?单项选择题
A
1998 to 2000
B
1993 to 1998
C
1990 to 1993
D
Economy started and ended in the same GDP level, 100, so there was never an expansion period
登录即可查看完整答案
我们收录了全球超50000道真实原题与详细解析,现在登录,立即获得答案。
类似问题
Use the following diagram to answer the next question. The phases of the business cycle from points A to D are, respectively
Based on your answer to the previous question, you know that the economy is currently in a boom .
Based on your answer to the previous question, you know that the economy is currently [ Select ] in a recession at potential in a boom .
A complete business cycle is described, in appropriate order, by which of the following sequences?
更多留学生实用工具
希望你的学习变得更简单
加入我们,立即解锁 海量真题 与 独家解析,让复习快人一步!