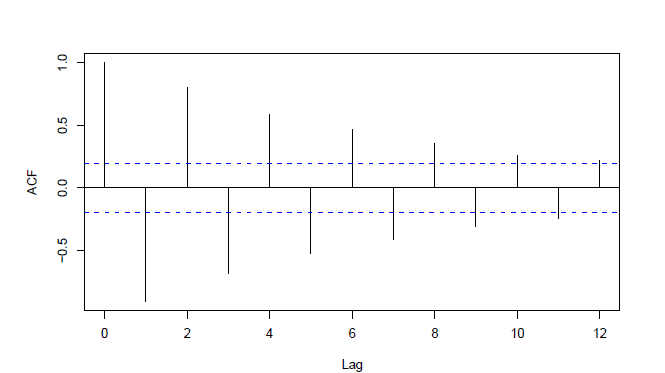
(On Problem 7 of the worksheet) Identify which autocorrelation plot corresponds to each value of 𝛼 . Plot 1: Plot 2: Plot 3: Plot 4: 1: Plot 1 2: Plot 2 3: Plot 3 4: Plot 4匹配题
A
0.9
B
0
C
0.5
D
-0.9
登录即可查看完整答案
我们收录了全球超50000道真实原题与详细解析,现在登录,立即获得答案。
类似问题
What is a fundamental difference between typical time series data and cross-sectional data that violates a standard OLS assumption?
Autocovariance in residuals of time series regression indicates that OLS should never be applied to estimate coefficients
A classical ordinary least squares (OLS) cannot be applied if the dependent variable exhibits autocovariance
If the d-statistic in the Durbin-Watson Test is 0.5,
更多留学生实用工具
希望你的学习变得更简单
加入我们,立即解锁 海量真题 与 独家解析,让复习快人一步!