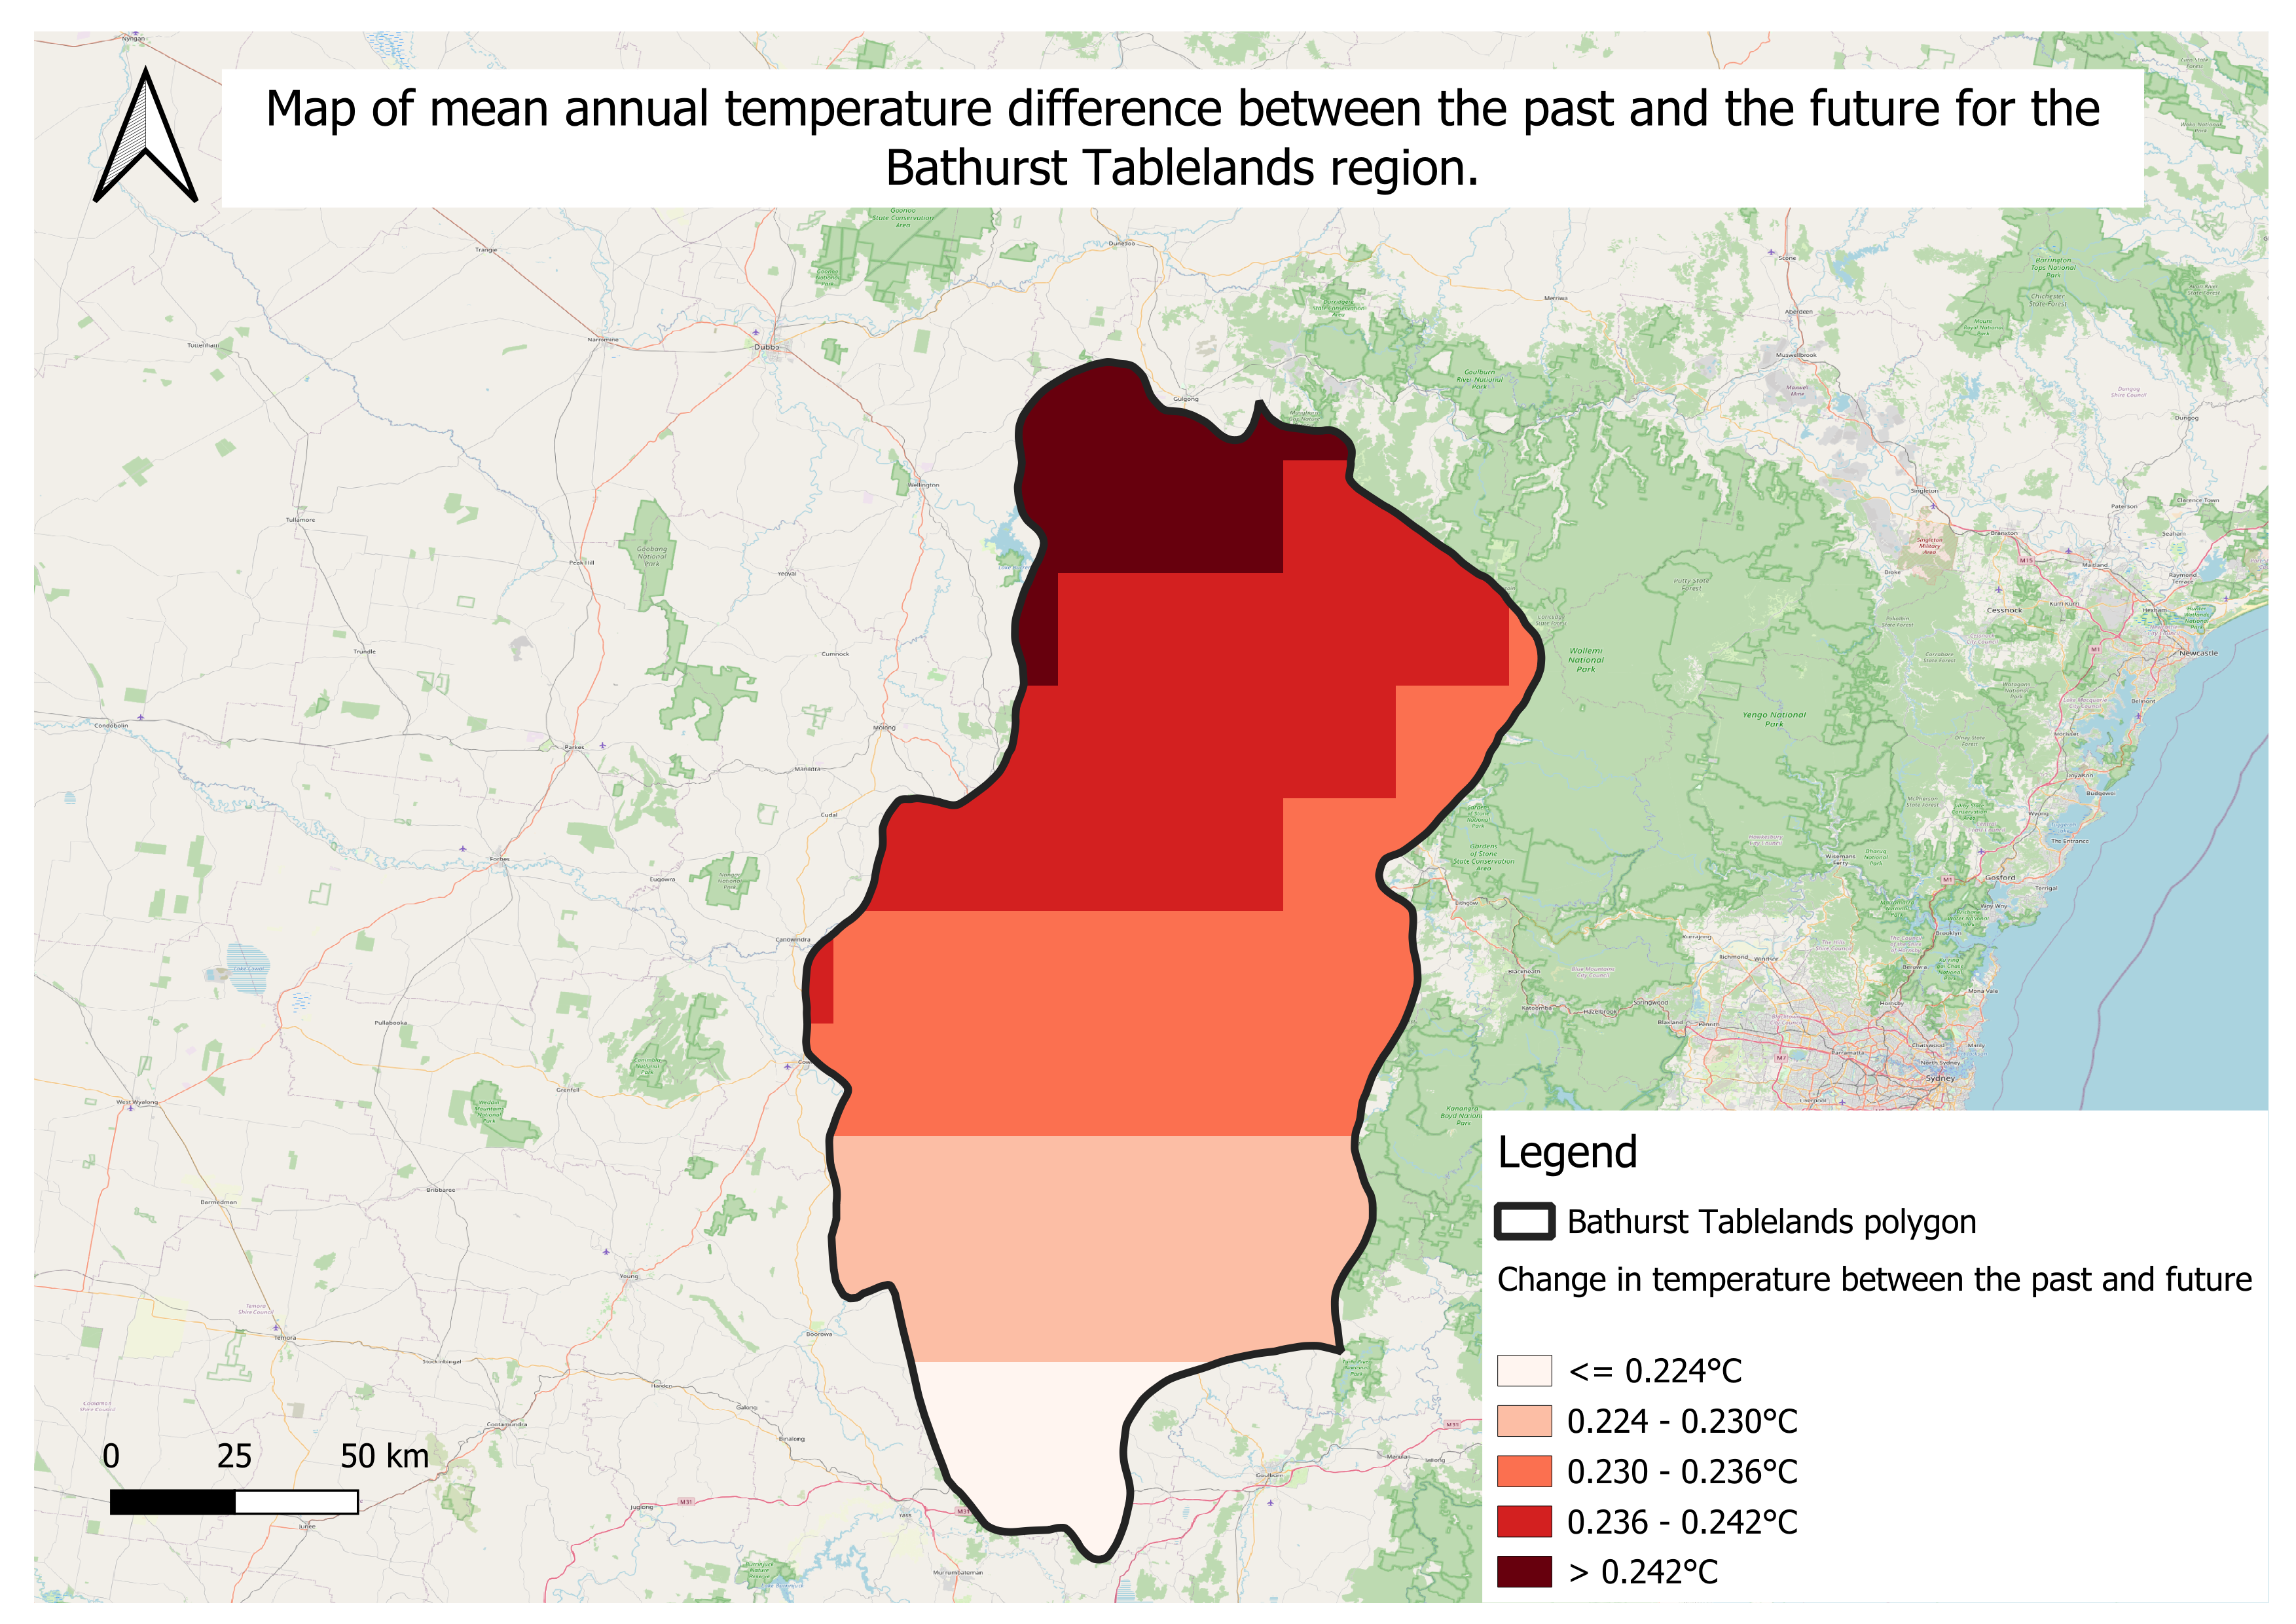
Below is a map of mean annual temperature difference between the historical baseline (past) and future for Bathurst Tablelands. How would you describe the spatial distribution (the visual pattern) of the temperature change across the region?Single choice
A
The climate has changed more towards the north of the region (>0.242 degrees celsius), compared to the south of the region (<0.224 degrees celsius).
B
Overall, there has been a decrease in annual temperature over time.
C
Overall, the mean annual temperature has increased by 0.2 degrees celsius over time.
D
There has been no change in temperature across the region.
Log in for full answers
We've collected over 50,000 authentic original questions and detailed explanations from around the globe. Log in now and get instant access to the answers!
More Practical Tools for Students Powered by AI Study Helper
Making Your Study Simpler
Join us and instantly unlock extensive past papers & exclusive solutions to get a head start on your studies!