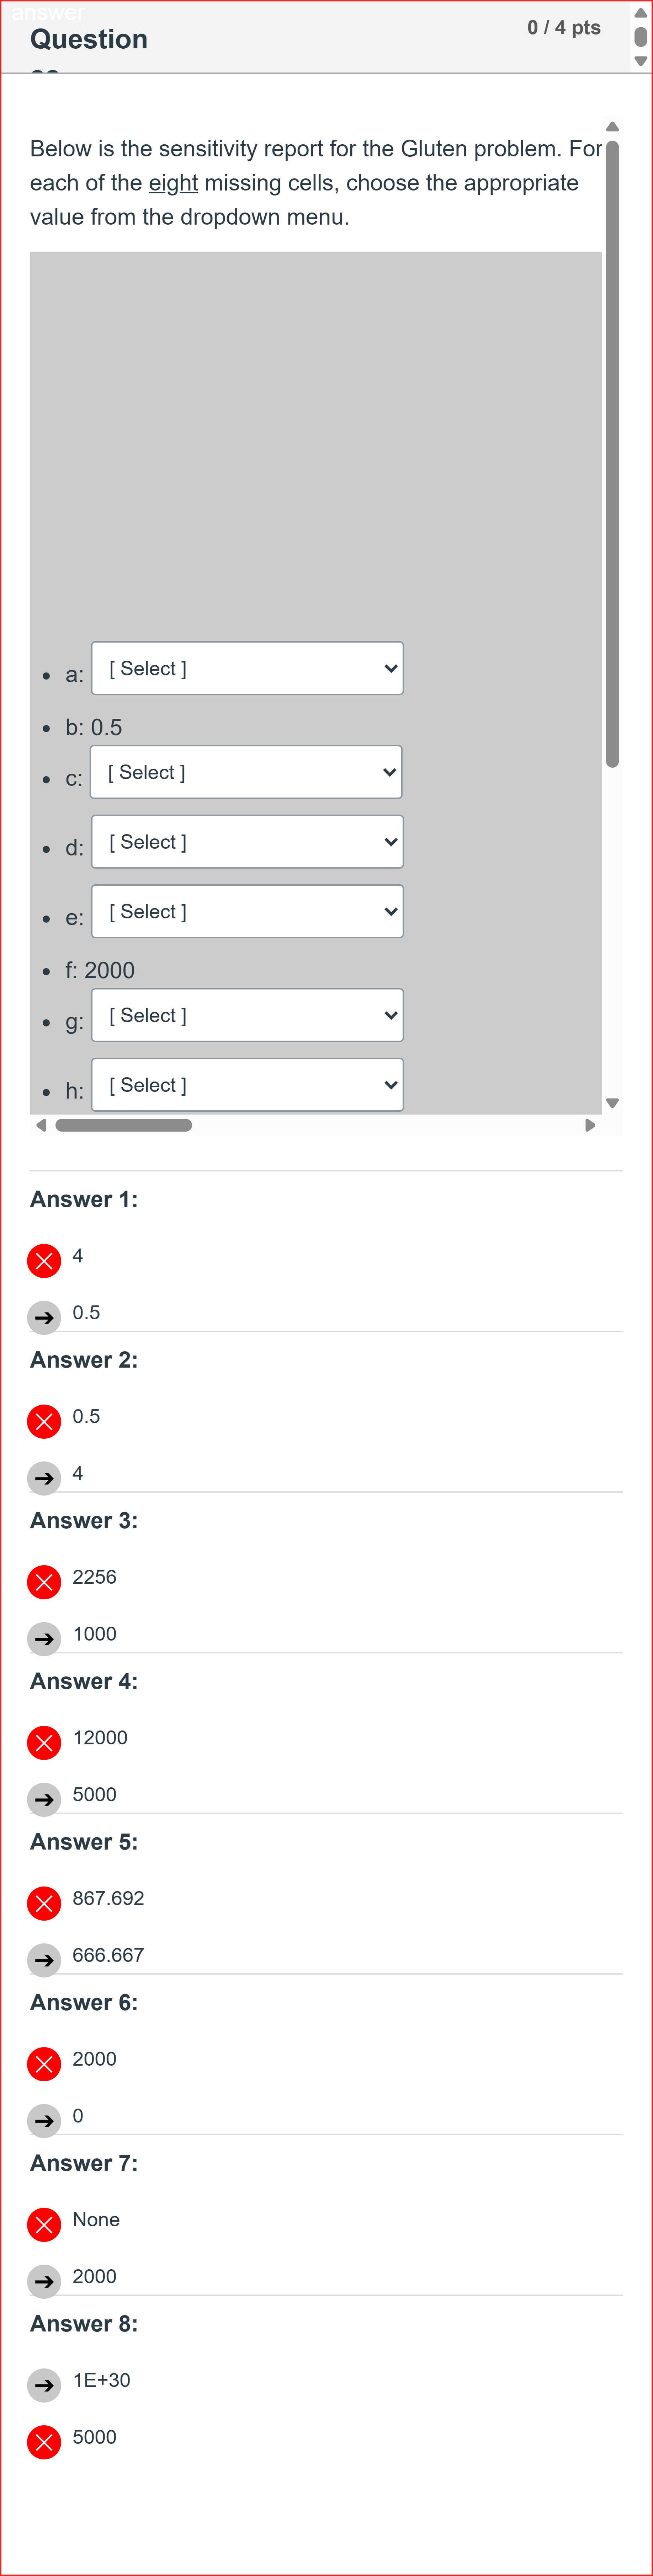
Below is the sensitivity report for the Gluten problem. For each of the eight missing cells, choose the appropriate value from the dropdown menu. a: [ Select ] 4 12000 None 250.667 3 1E-30 2000 0 666.667 0.5 1000 5000 867.692 840 2256 160 1E+30 b: 0.5 c: [ Select ] None 12000 2256 1E+30 250.667 3 4 0 840 666.667 2000 0.5 160 1000 1E-30 5000 867.692 d: [ Select ] 12000 840 0 5000 0.5 666.667 2000 1000 4 160 250.667 1E+30 1E-30 None 2256 3 867.692 e: [ Select ] 12000 840 867.692 3 5000 0 0.5 1E+30 None 1000 4 2000 1E-30 666.667 2256 260.667 160 f: 2000 g: [ Select ] 0.5 5000 1000 840 666.667 4 3 867.692 250.667 12000 1E-30 None 160 2256 0 2000 1E+30 h: [ Select ] 160 1E+30 250.667 4 840 1E-30 0 None 1000 12000 3 0.5 2256 867.692 666.667 2000 5000Multiple dropdown selections
Log in for full answers
We've collected over 50,000 authentic original questions and detailed explanations from around the globe. Log in now and get instant access to the answers!
Similar Questions
OPTIMIZATION AND EXCEL SOLVER Following is the Sensitivity Report of an Excel Solver Optimization problem. This is a revenue maximization problem. What is the impact of increasing the quantity of silk by 10 units?
Using the data from the example in class, conduct sensitivity analysis to PRICE. Assume tax rate of 21%. What is the projected NI at the lower price level?
Which of the following is NOT a question answered by standard sensitivity analysis information?
The upper limit of the third coefficient of the objective function is _________ .
More Practical Tools for Students Powered by AI Study Helper
Making Your Study Simpler
Join us and instantly unlock extensive past papers & exclusive solutions to get a head start on your studies!