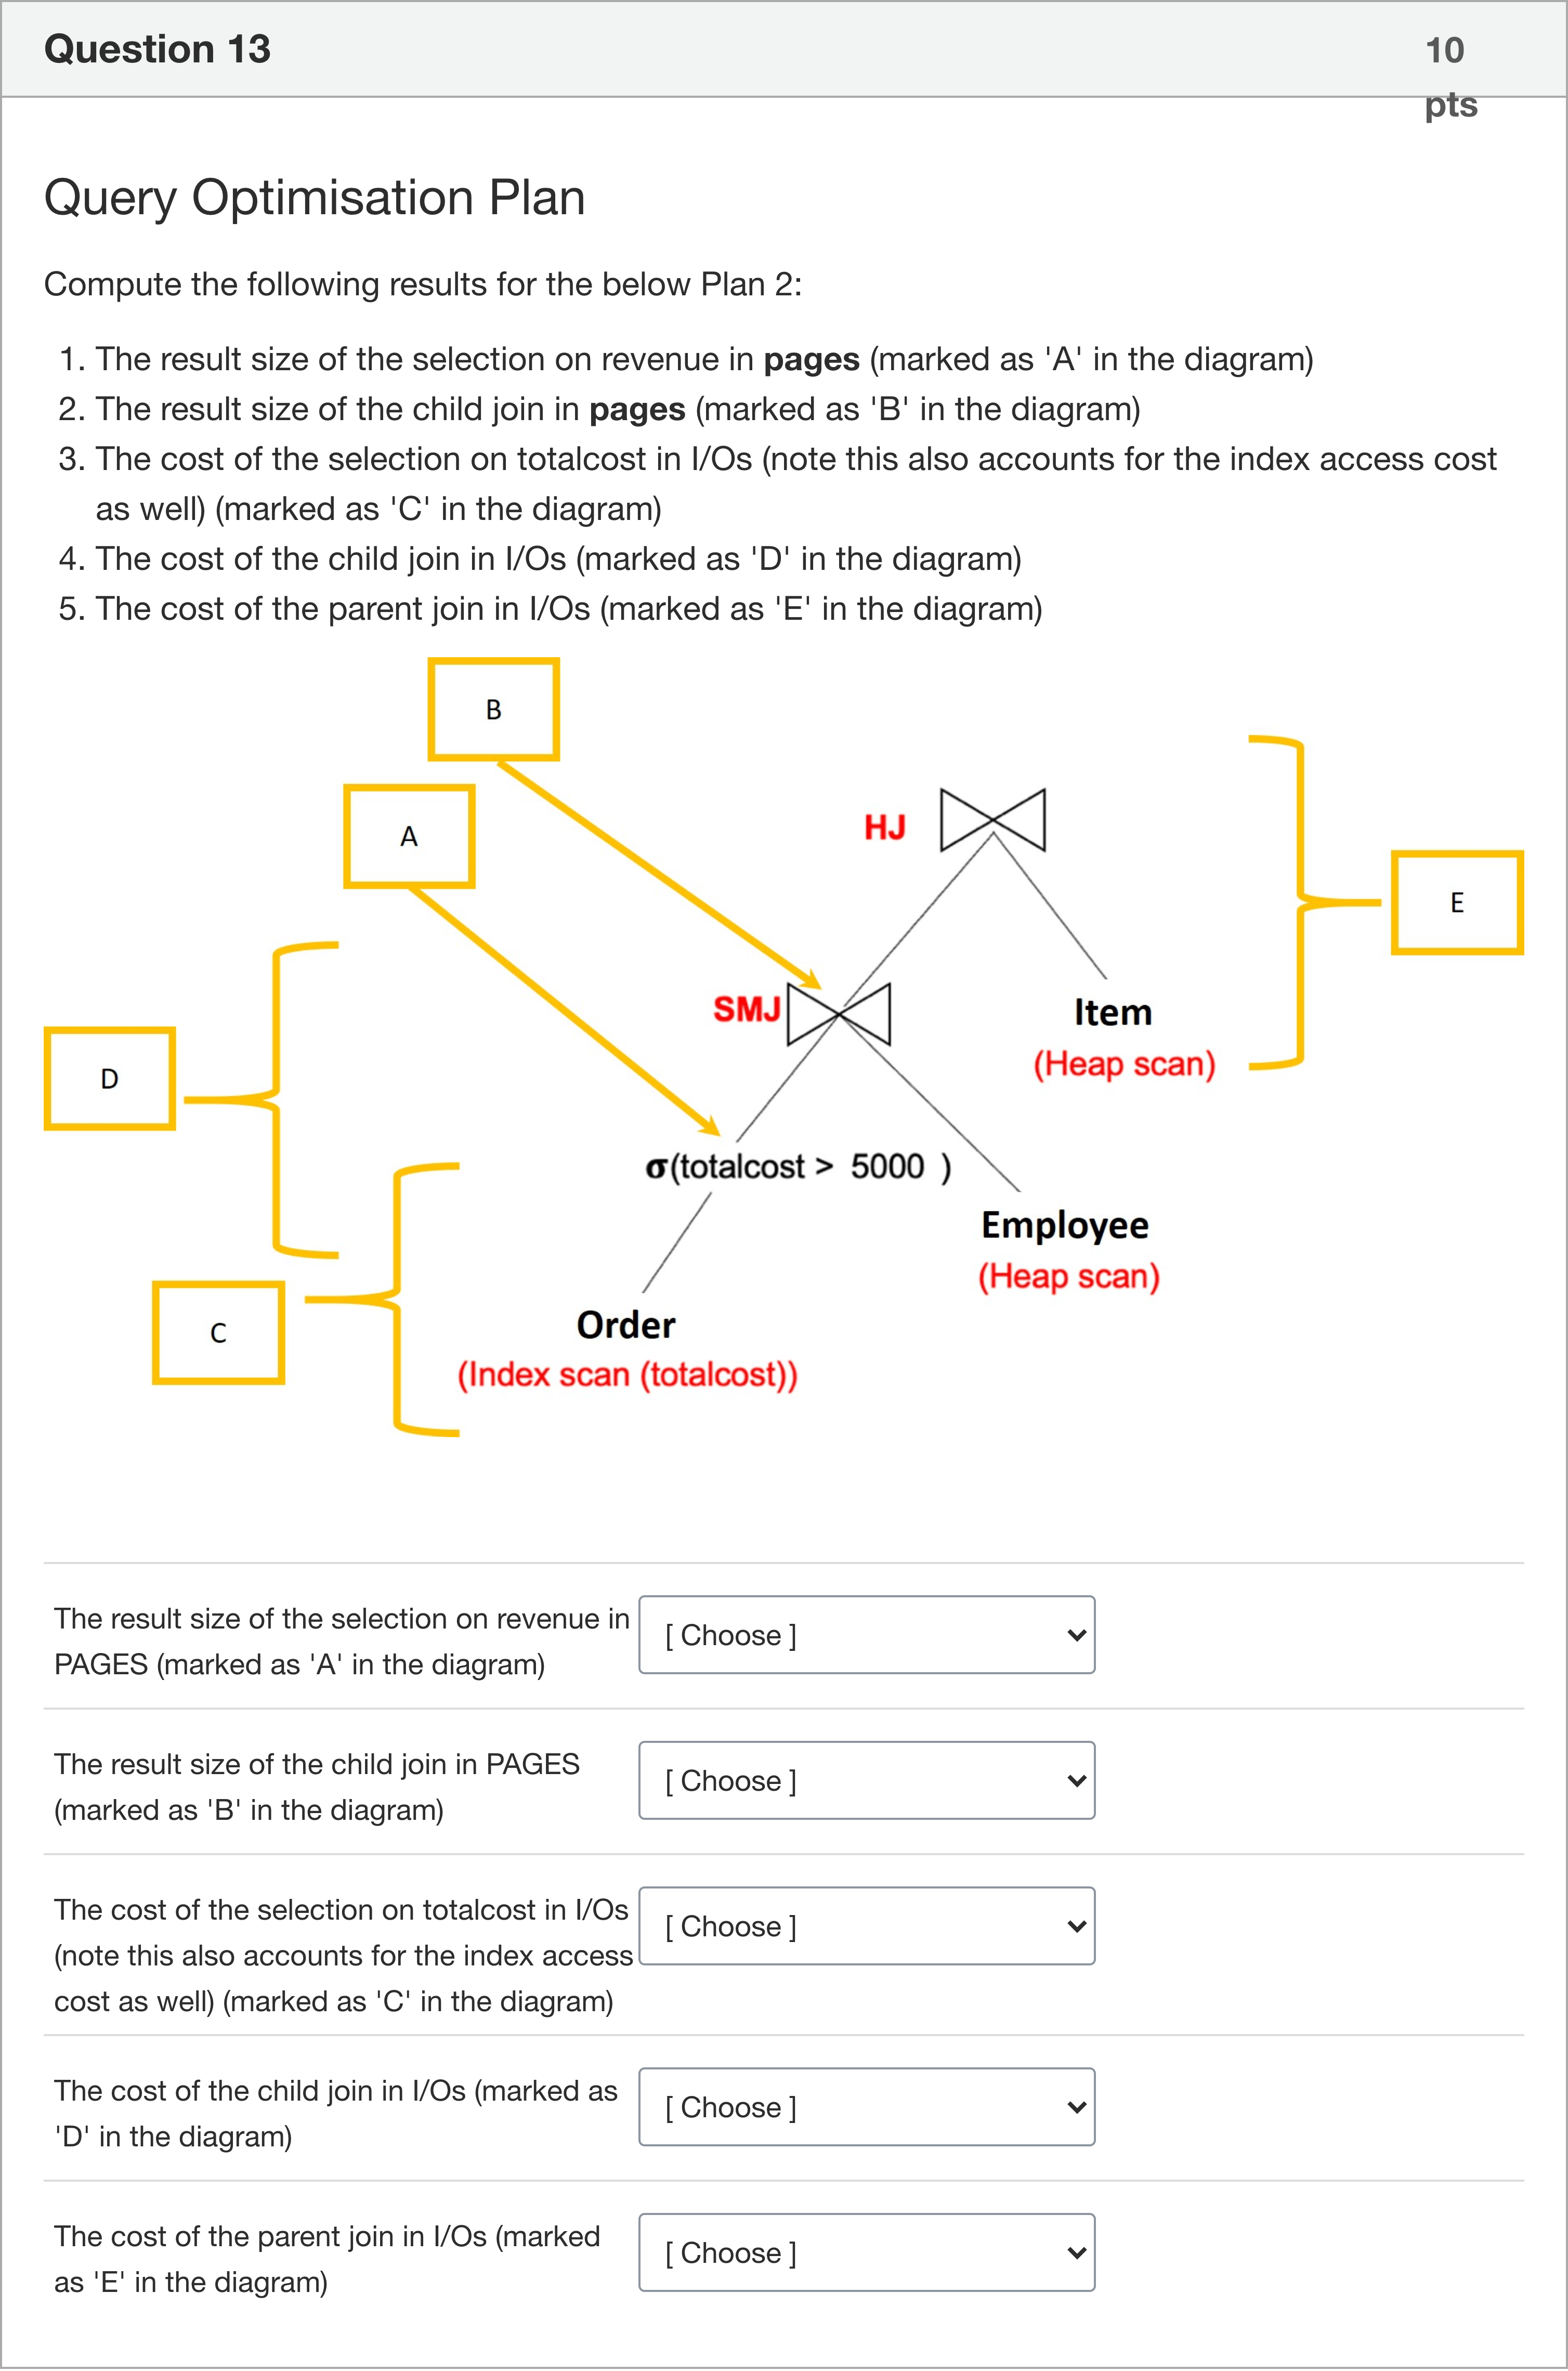
Query Optimisation Plan Compute the following results for the below Plan 2: The result size of the selection on revenue in pages (marked as 'A' in the diagram) The result size of the child join in pages (marked as 'B' in the diagram) The cost of the selection on totalcost in I/Os (note this also accounts for the index access cost as well) (marked as 'C' in the diagram) The cost of the child join in I/Os (marked as 'D' in the diagram) The cost of the parent join in I/Os (marked as 'E' in the diagram) 1: The result size of the selection on revenue in PAGES (marked as 'A' in the diagram) 2: The result size of the child join in PAGES (marked as 'B' in the diagram) 3: The cost of the selection on totalcost in I/Os (note this also accounts for the index access cost as well) (marked as 'C' in the diagram) 4: The cost of the child join in I/Os (marked as 'D' in the diagram) 5: The cost of the parent join in I/Os (marked as 'E' in the diagram)Matching
A
6,000
B
9,040
C
9,200
D
3,000
E
24,050
F
18,040
G
6,300
H
300,000
I
3,025
J
6,050
K
12,050
Log in for full answers
We've collected over 50,000 authentic original questions and detailed explanations from around the globe. Log in now and get instant access to the answers!
Similar Questions
The cut-and-try approach will always identify the aggregate plan with the lowest overall cost.
Query Optimisation Plan 2 Compute the following results for the below Plan 2: The result size of the selection on vendor in pages (marked as 'A' in the diagram) The result size of the child join in pages (marked as 'B' in the diagram) The cost of the selection on vendor in I/Os (note this also accounts for the index access cost as well) (marked as 'C' in the diagram) The cost of the child join in I/Os (marked as 'D' in the diagram) The cost of the parent join in I/Os (marked as 'E' in the diagram) Figure 3.3.2: PLAN 2. 1: The result size of the selection on Vendor in PAGES (marked as 'A' in the diagram) 2: The result size of the child join in PAGES (marked as 'B' in the diagram) 3: The cost of the selection on Vendor in I/Os (note this also accounts for the index access cost as well) (marked as 'C' in the diagram) 4: The cost of the child join in I/Os (marked as 'D' in the diagram) 5: The cost of the parent join in I/Os (marked as 'E' in the diagram)
Query Optimisation Plan 1 Compute the following results for the below Plan 1: The result size of the child join in pages (marked as 'A' in the diagram) The cost of the child join in I/Os (marked as 'B' in the diagram). The cost of the parent join in I/Os (marked as 'C' in the diagram) Figure 3.3.1: PLAN 1. 1: The result size of the child join in PAGES (marked as 'A' in the diagram) 2: The cost of the child join in I/Os (marked as 'B' in the diagram) 3: The cost of the parent join in I/Os (marked as 'C' in the diagram)
Single Relation Plan C What would happen if our query changed and became: SELECT hotspotID FROM hotspot WHERE postcode = 2600 AND establishmentYear > 2020 AND establishmentYear < 2022; Assuming that the unclustered B+tree index on establishmentYear from the previous question is the only index available, would the cost of the best plan change?
More Practical Tools for Students Powered by AI Study Helper
Making Your Study Simpler
Join us and instantly unlock extensive past papers & exclusive solutions to get a head start on your studies!