The table below shows annual production possibilities (’000 million per year) for a country that can produce only apple or orange with the resources available. Which of the following statements about this country’s PPF is INCORRECT?Single choice
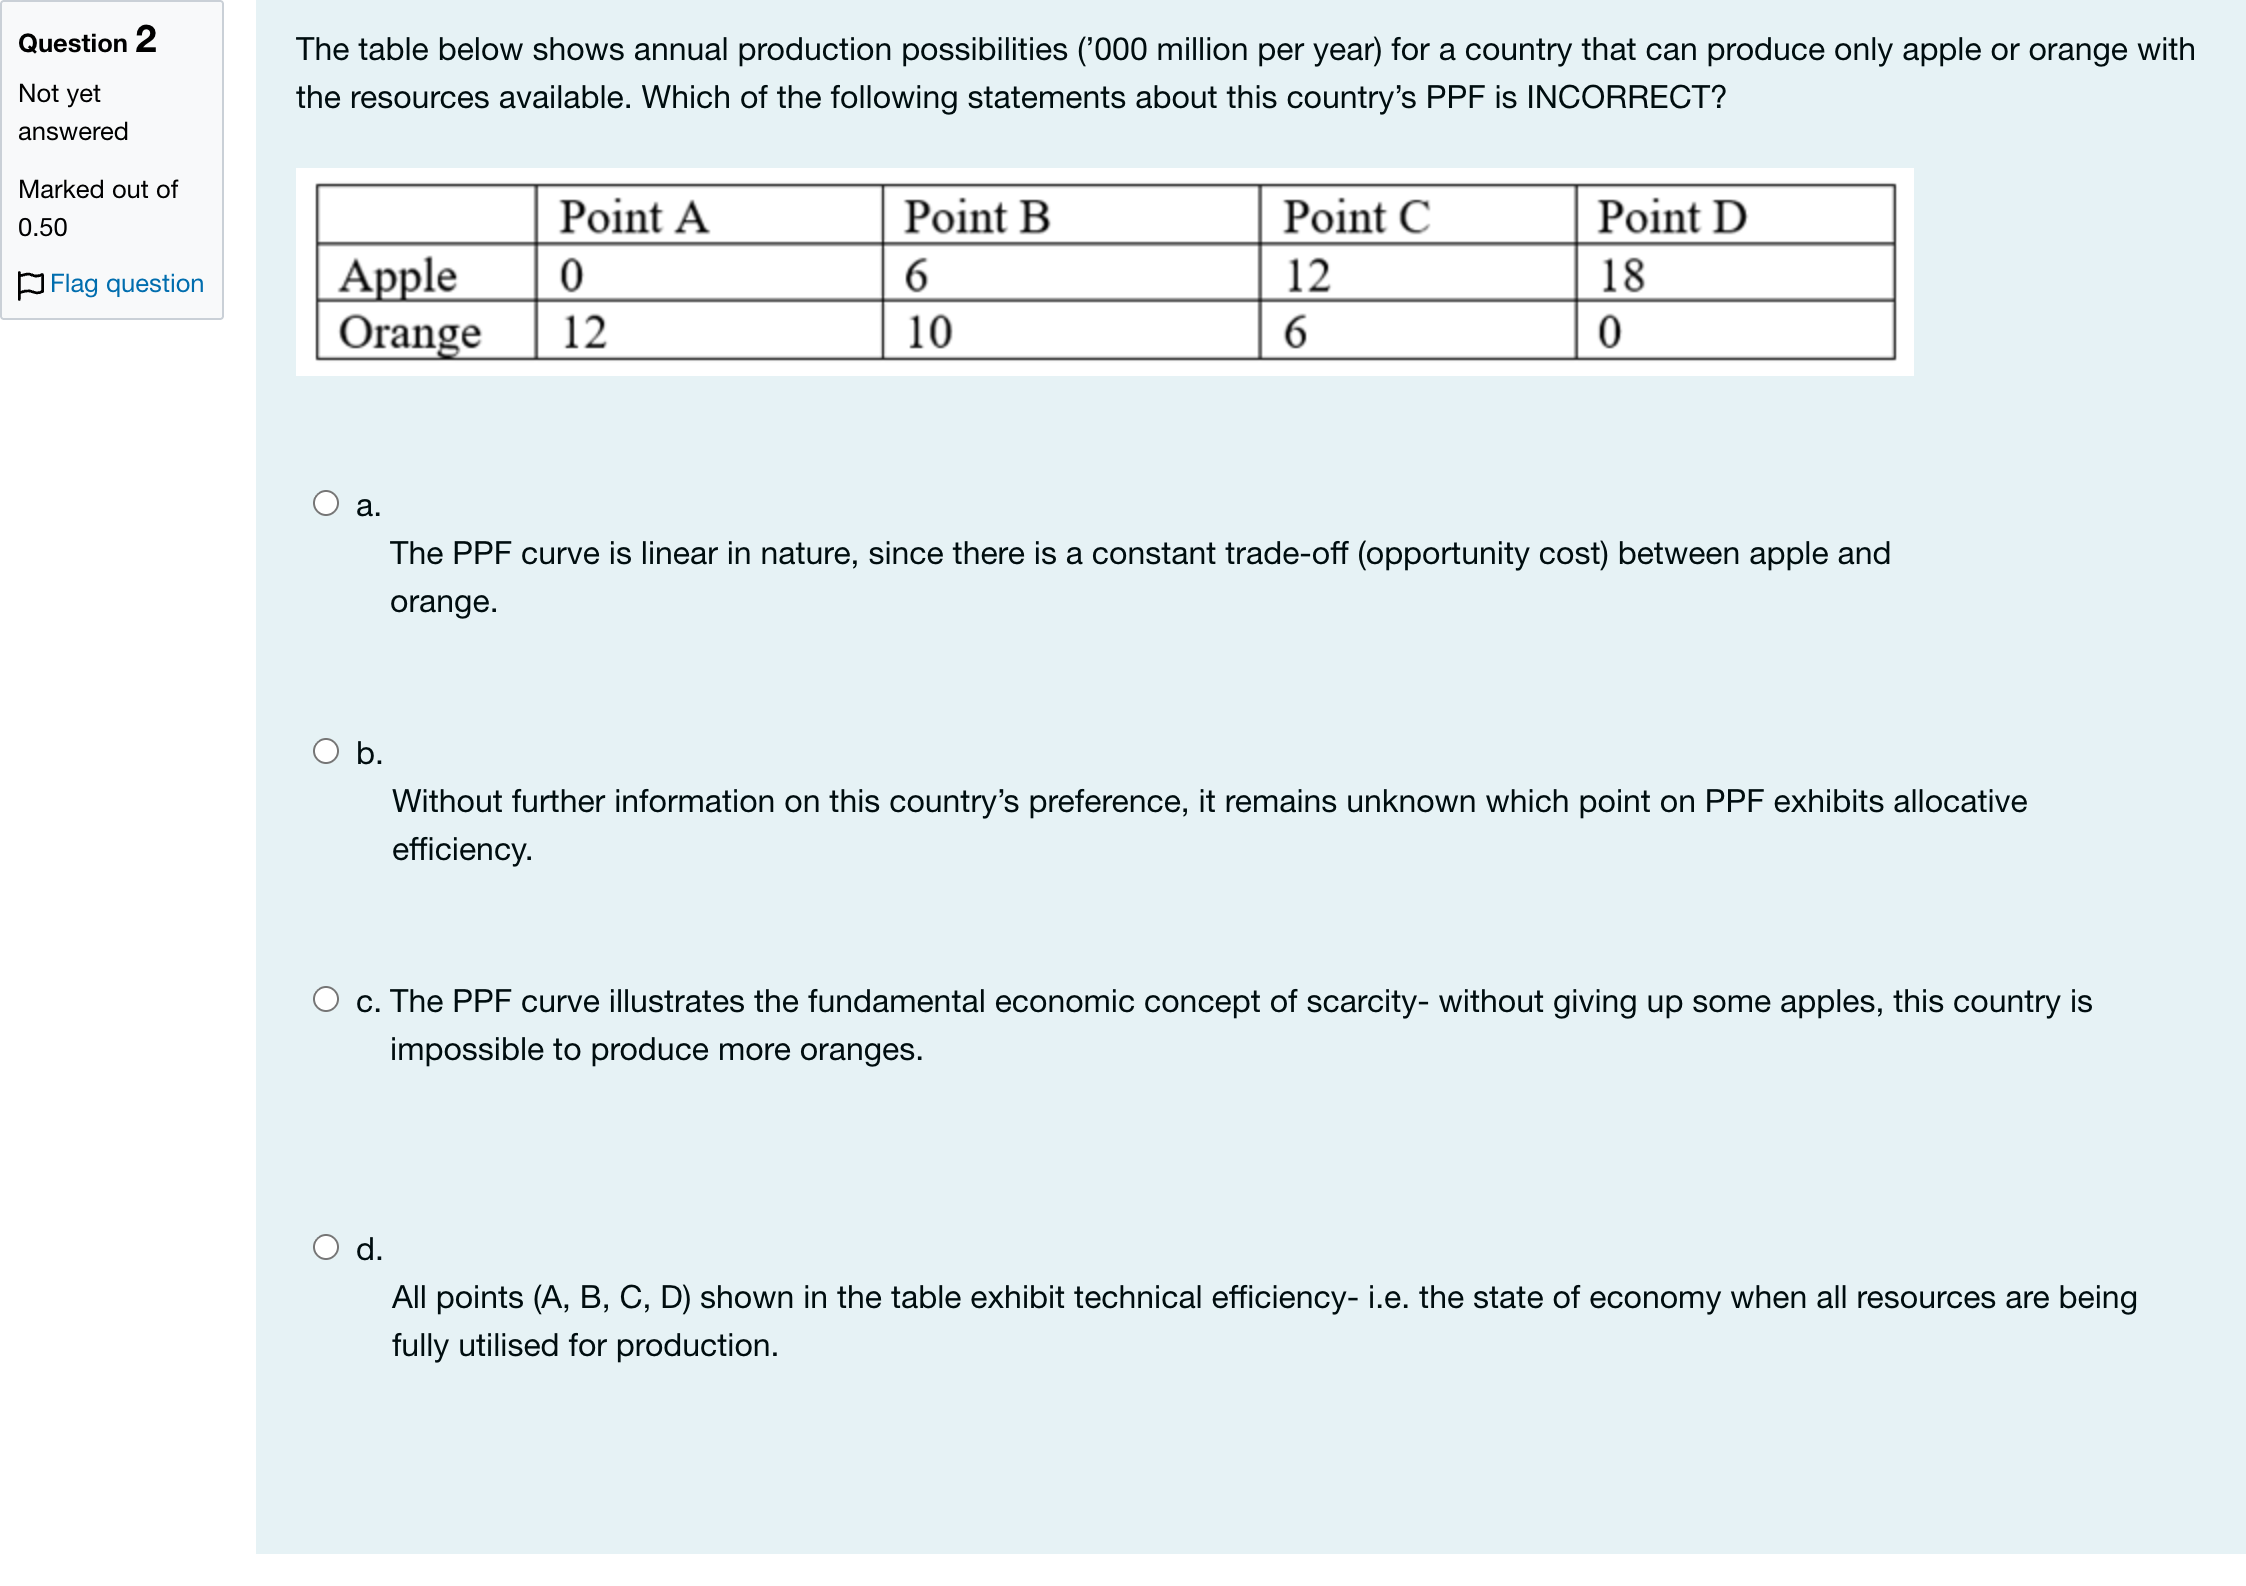
a. The PPF curve is linear in nature, since there is a constant trade-off (opportunity cost) between apple and orange.
b. Without further information on this country’s preference, it remains unknown which point on PPF exhibits allocative efficiency.
c. The PPF curve illustrates the fundamental economic concept of scarcity- without giving up some apples, this country is impossible to produce more oranges.
d. All points (A, B, C, D) shown in the table exhibit technical efficiency- i.e. the state of economy when all resources are being fully utilised for production.
Log in for full answers
We've collected over 50,000 authentic original questions and detailed explanations from around the globe. Log in now and get instant access to the answers!
Similar Questions
Consider the PPF shown in the graph below to answer the question. Given current resources and technology, the attainable range is best described as:
On a production possibilities frontier (PPF) that shows the trade-off between consumer goods and capital goods given a fixed amount of labour, unemployment is illustrated by:
Refer to the following graph to answer the next question. In the graph, Point B is
The following diagram shows a farmer’s choice between free time and grain before (A) and after (B) an improvement in technology. Based on this information, read the following statements and select the correct one(s).
More Practical Tools for Students Powered by AI Study Helper
Making Your Study Simpler
Join us and instantly unlock extensive past papers & exclusive solutions to get a head start on your studies!