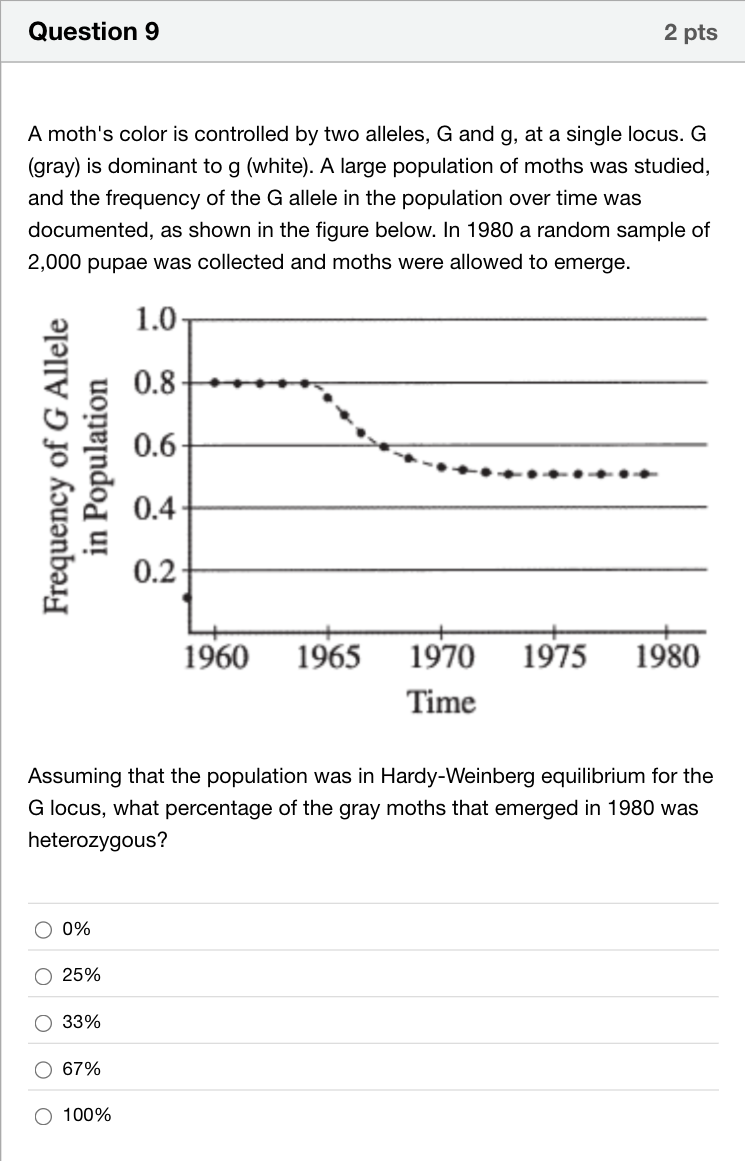
A moth's color is controlled by two alleles, G and g, at a single locus. G (gray) is dominant to g (white). A large population of moths was studied, and the frequency of the G allele in the population over time was documented, as shown in the figure below. In 1980 a random sample of 2,000 pupae was collected and moths were allowed to emerge. Each figure shows an image of a stickleback fish with a genetic structure below it. The left figure is labeled Figure 1. Marine stickleback. A long Pelvic Spine on the fish is labeled. The genetic structure below the fish contains three enhancers, a promoter, and a gene. From left to right, the Enhancer Sequences are labeled Hindlimb, Pituitary, and Jaw. To the right of the Enhancer Sequences is a Promoter with an arrow moving up and to the right, over the top of the Pitx1 gene. The right figure is labeled Figure 2. Freshwater stickleback. A short Pelvic Spine on the fish is labeled. The genetic structure below the fish contains three enhancers, a promoter, and a gene. From left to right, the Enhancer Sequences are labeled Hindlimb, Pituitary, and Jaw. The Hindlimb enhancer is crossed out with an X, and it is labeled Disabled Due to Mutation. To the right of the Enhancer Sequences is a Promoter with an arrow moving up and to the right, over the top of the Pitx1 gene. Assuming that the population was in Hardy-Weinberg equilibrium for the G locus, what percentage of the gray moths that emerged in 1980 was heterozygous?Single choice
A
0%
B
25%
C
33%
D
67%
E
100%
Log in for full answers
We've collected over 50,000 authentic original questions and detailed explanations from around the globe. Log in now and get instant access to the answers!
Similar Questions
A group of people whose ancestors immigrated to North America 200 years ago have certain allele frequencies that differ significantly from those in surrounding populations in the United States. Which of the following is the most likely explanation for the difference in allele frequencies?
Students observed the distribution of different color phenotypes in northern ravine salamanders (Plethodon electromorphus) before and after a spring flood. The data are shown in Table 1. Table 1. Salamander Distribution Before and After a flood Salamander Distribution Before the Flood (n) Salamander Distribution After the Flood (n) Black phenotype 13 7 Dark-brown phenotype 25 14 Light-brown phenotype 6 3 Which of the following is an appropriate null hypothesis regarding the phenotypic frequencies of this population of salamanders before and after the flood?
In a population of flowering plants, there are two alleles for flower color. One is dominant and is represented A, the other is recessive and is represented a. The allele frequency of A is 0.7. How do you calculate the frequency of homozygous recessive individuals in the population?
In a population of 1000 flowers there are two possible alleles for flower color, one dominant and one recessive. 400 plants are homozygous dominant, 200 plants are heterozygous, and 400 plants are homozygous recessive. How many recessive alleles are in the gene pool?
More Practical Tools for Students Powered by AI Study Helper
Making Your Study Simpler
Join us and instantly unlock extensive past papers & exclusive solutions to get a head start on your studies!