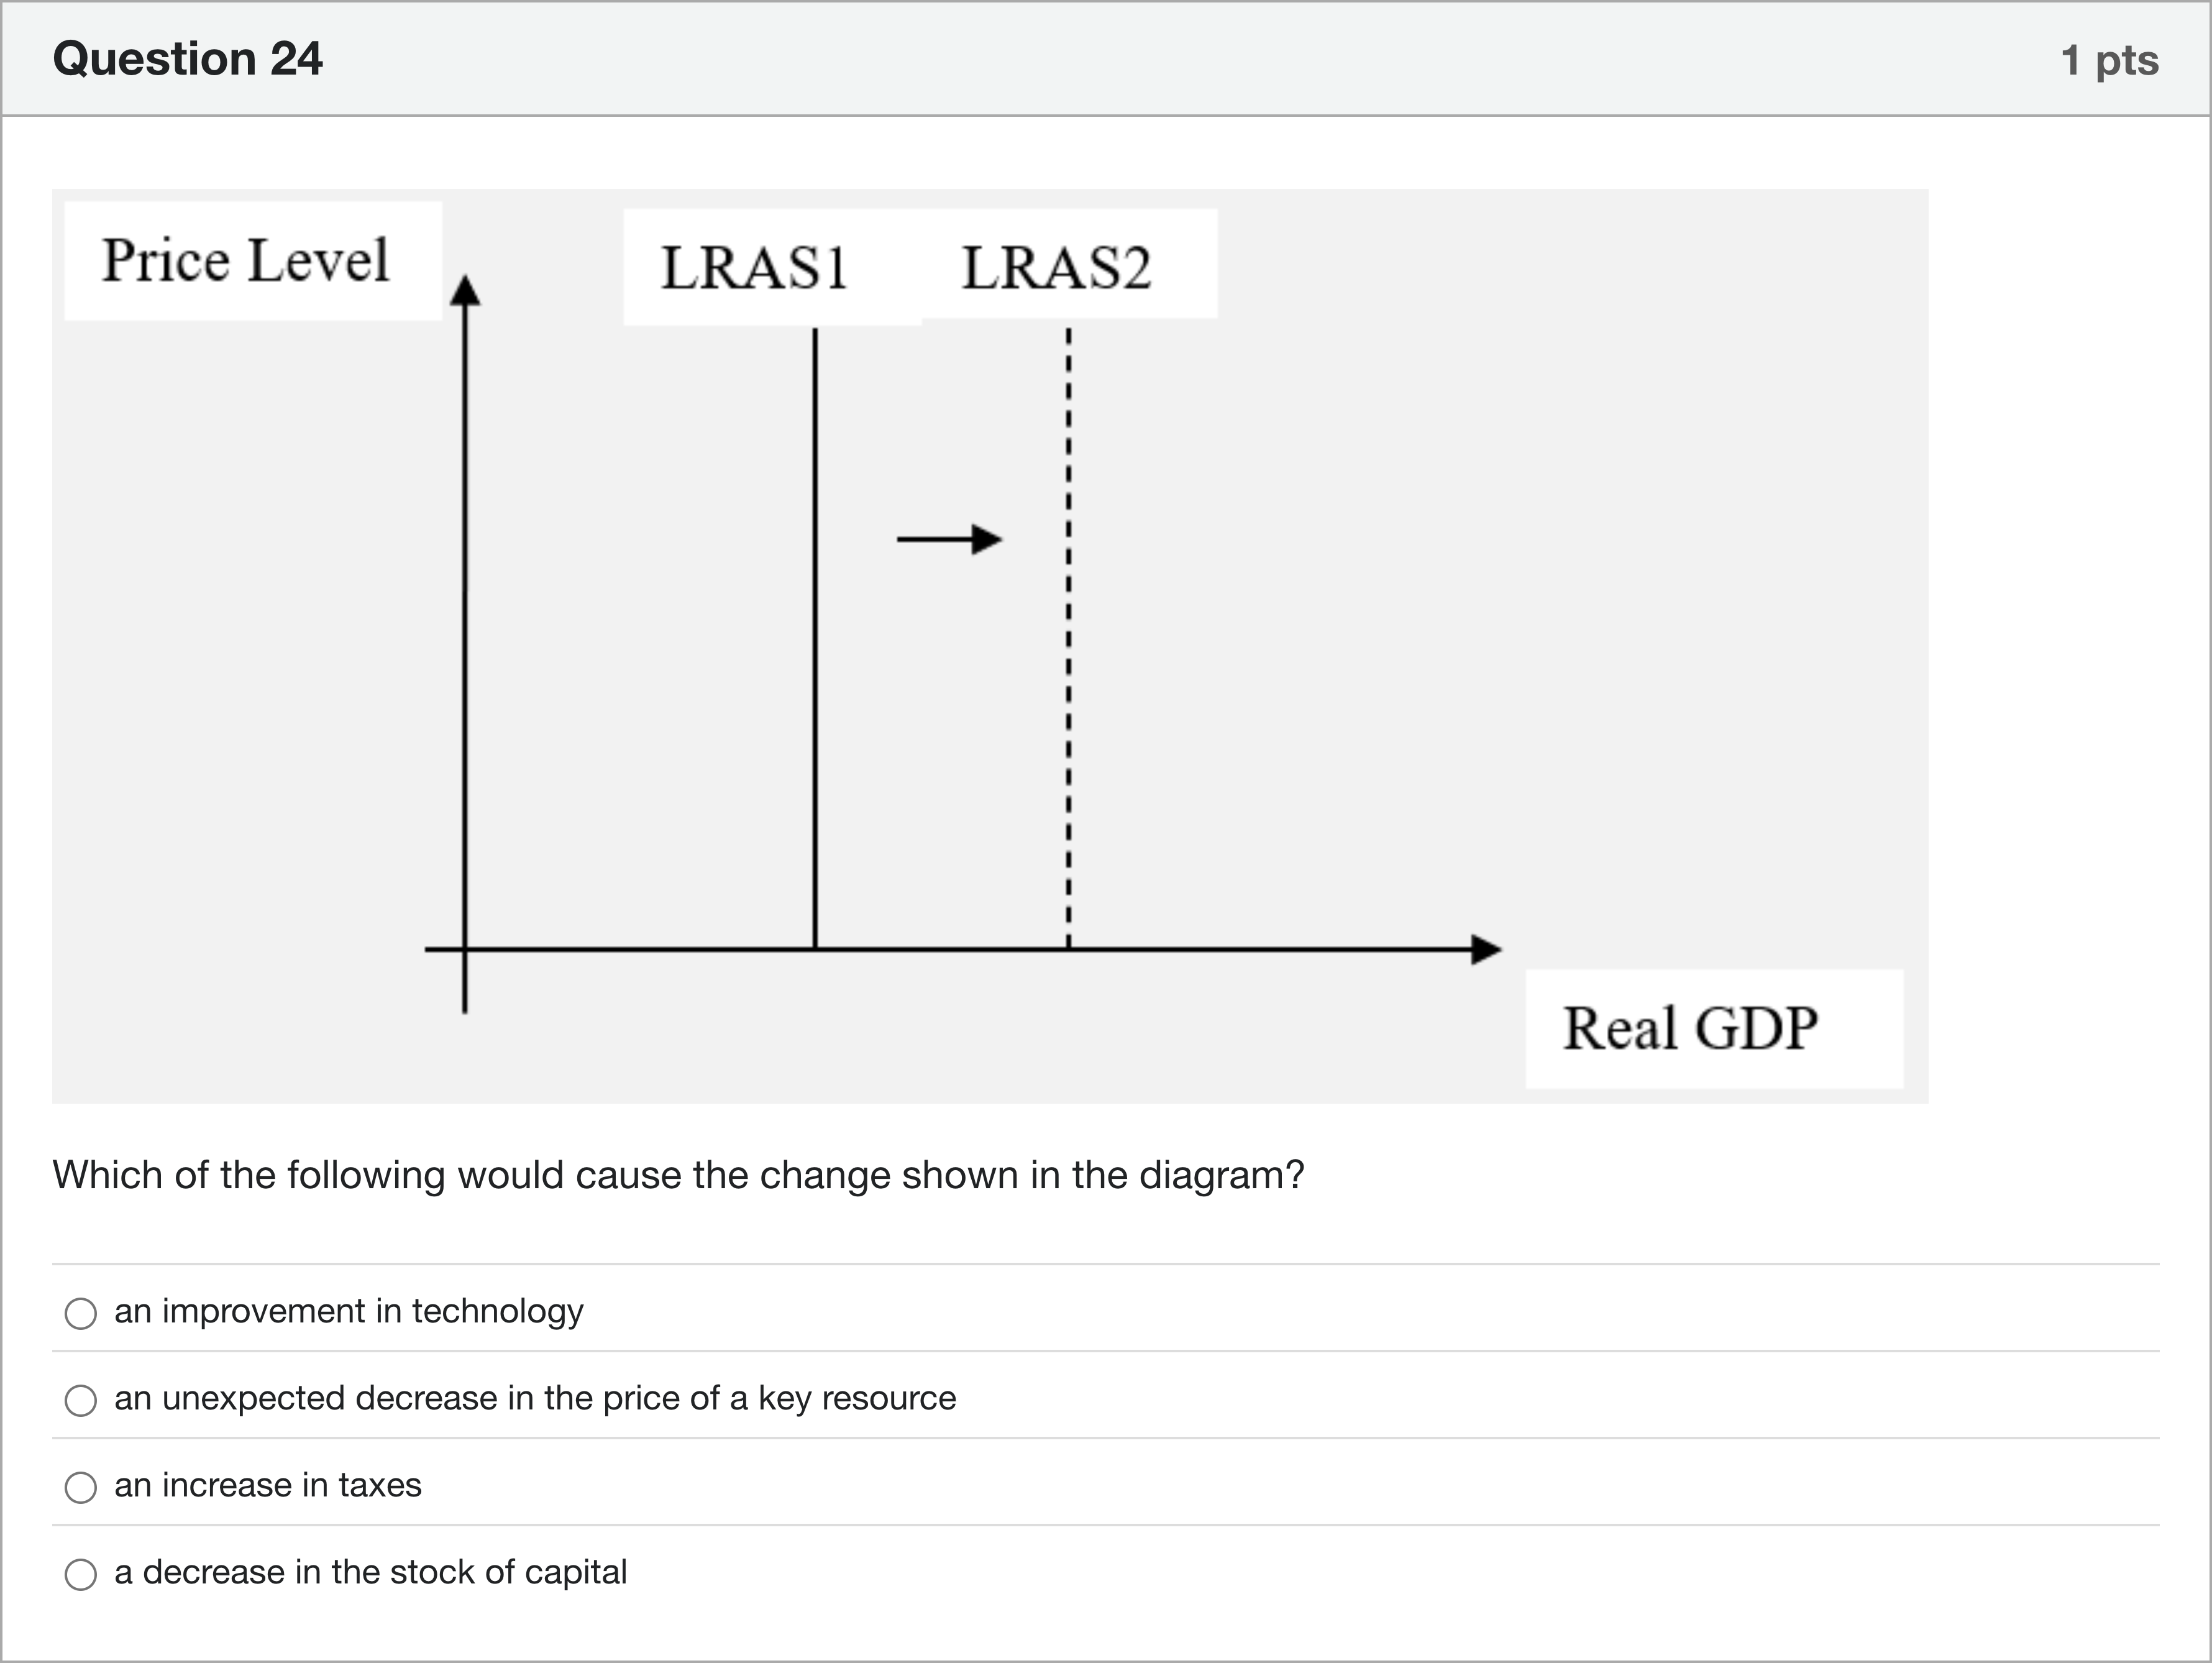
Which of the following would cause the change shown in the diagram?Single choice
A
an improvement in technology
B
an unexpected decrease in the price of a key resource
C
an increase in taxes
D
a decrease in the stock of capital
Log in for full answers
We've collected over 50,000 authentic original questions and detailed explanations from around the globe. Log in now and get instant access to the answers!
Similar Questions
The long-run aggregate supply curve is vertical at the level of output:
In the long run, the output of the economy:
In countries that have high minimum wages and require a lengthy and costly process to get permission to open a business,
In the figure above, what do the classical/neoclassical economists suggest in terms of achieving full employment in the Long Run?
More Practical Tools for Students Powered by AI Study Helper
Making Your Study Simpler
Join us and instantly unlock extensive past papers & exclusive solutions to get a head start on your studies!