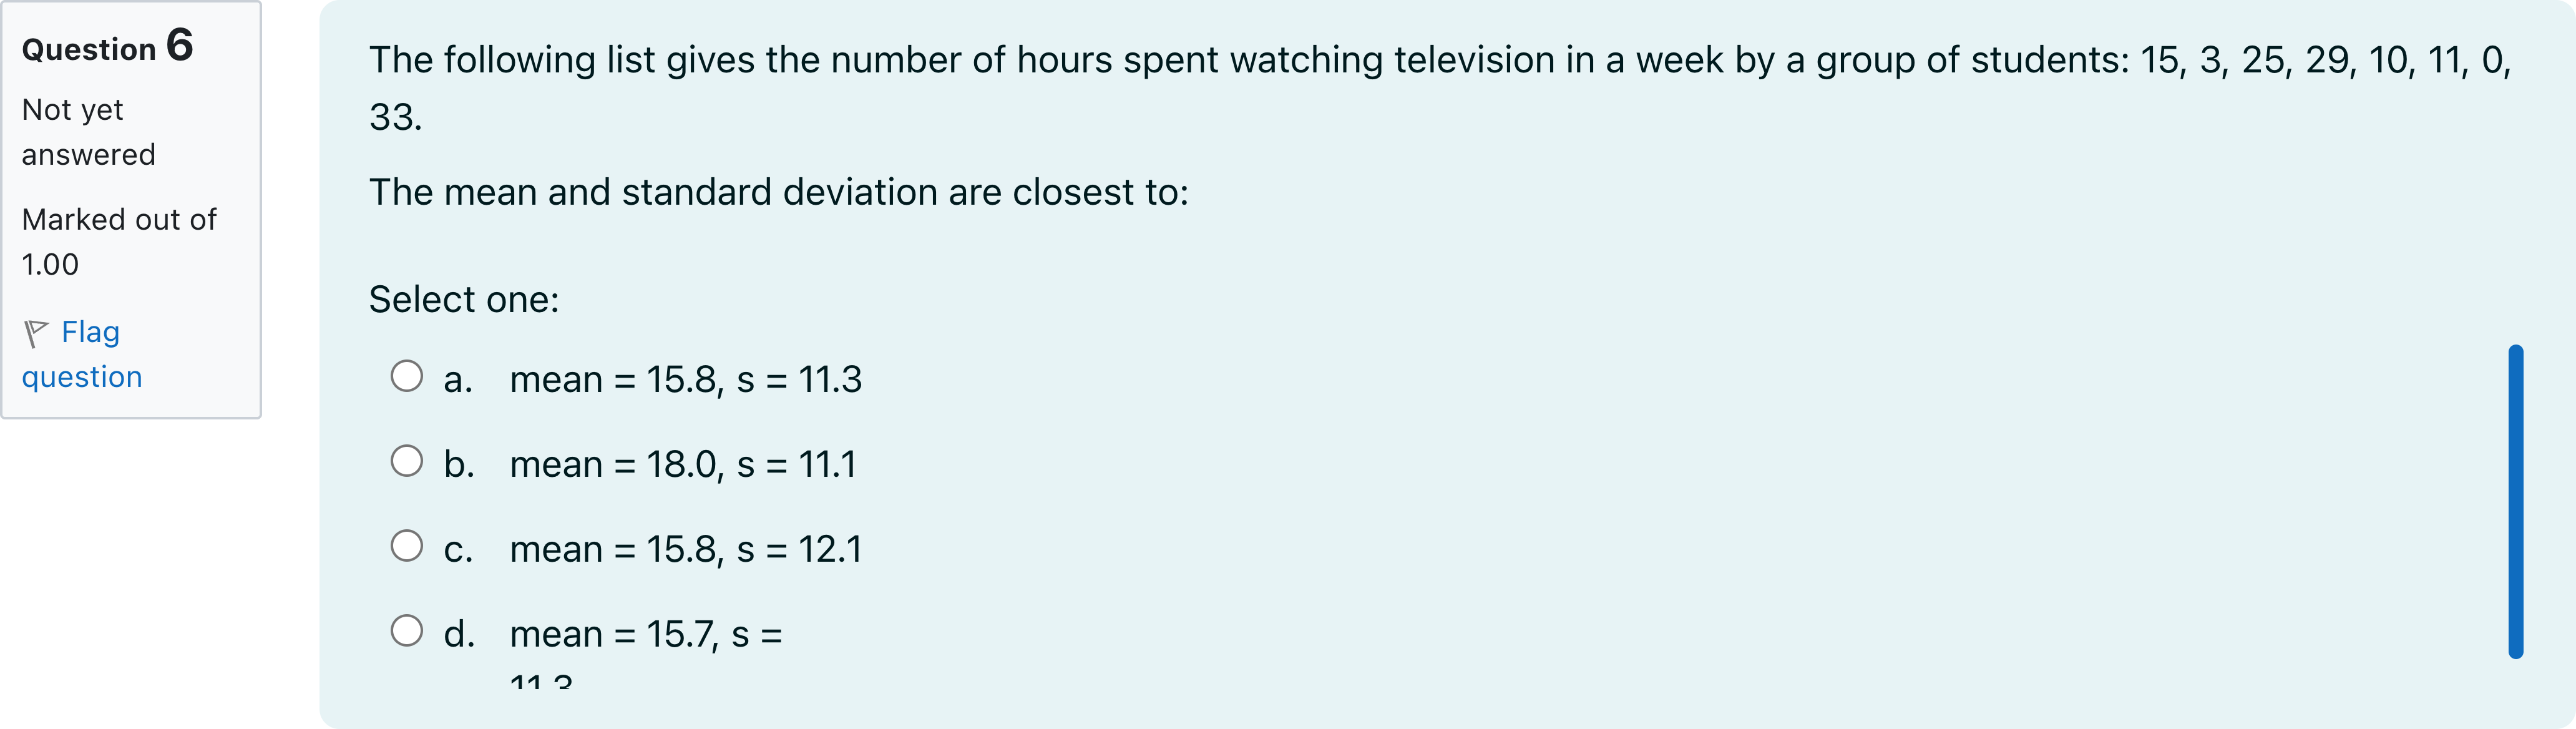
The following list gives the number of hours spent watching television in a week by a group of students: 15, 3, 25, 29, 10, 11, 0, 33.The mean and standard deviation are closest to:Single choice
A
a. mean = 15.8, s = 11.3
B
b. mean = 18.0, s = 11.1
C
c. mean = 15.8, s = 12.1
D
d. mean = 15.7, s = 11.3
Log in for full answers
We've collected over 50,000 authentic original questions and detailed explanations from around the globe. Log in now and get instant access to the answers!
More Practical Tools for Students Powered by AI Study Helper
Making Your Study Simpler
Join us and instantly unlock extensive past papers & exclusive solutions to get a head start on your studies!