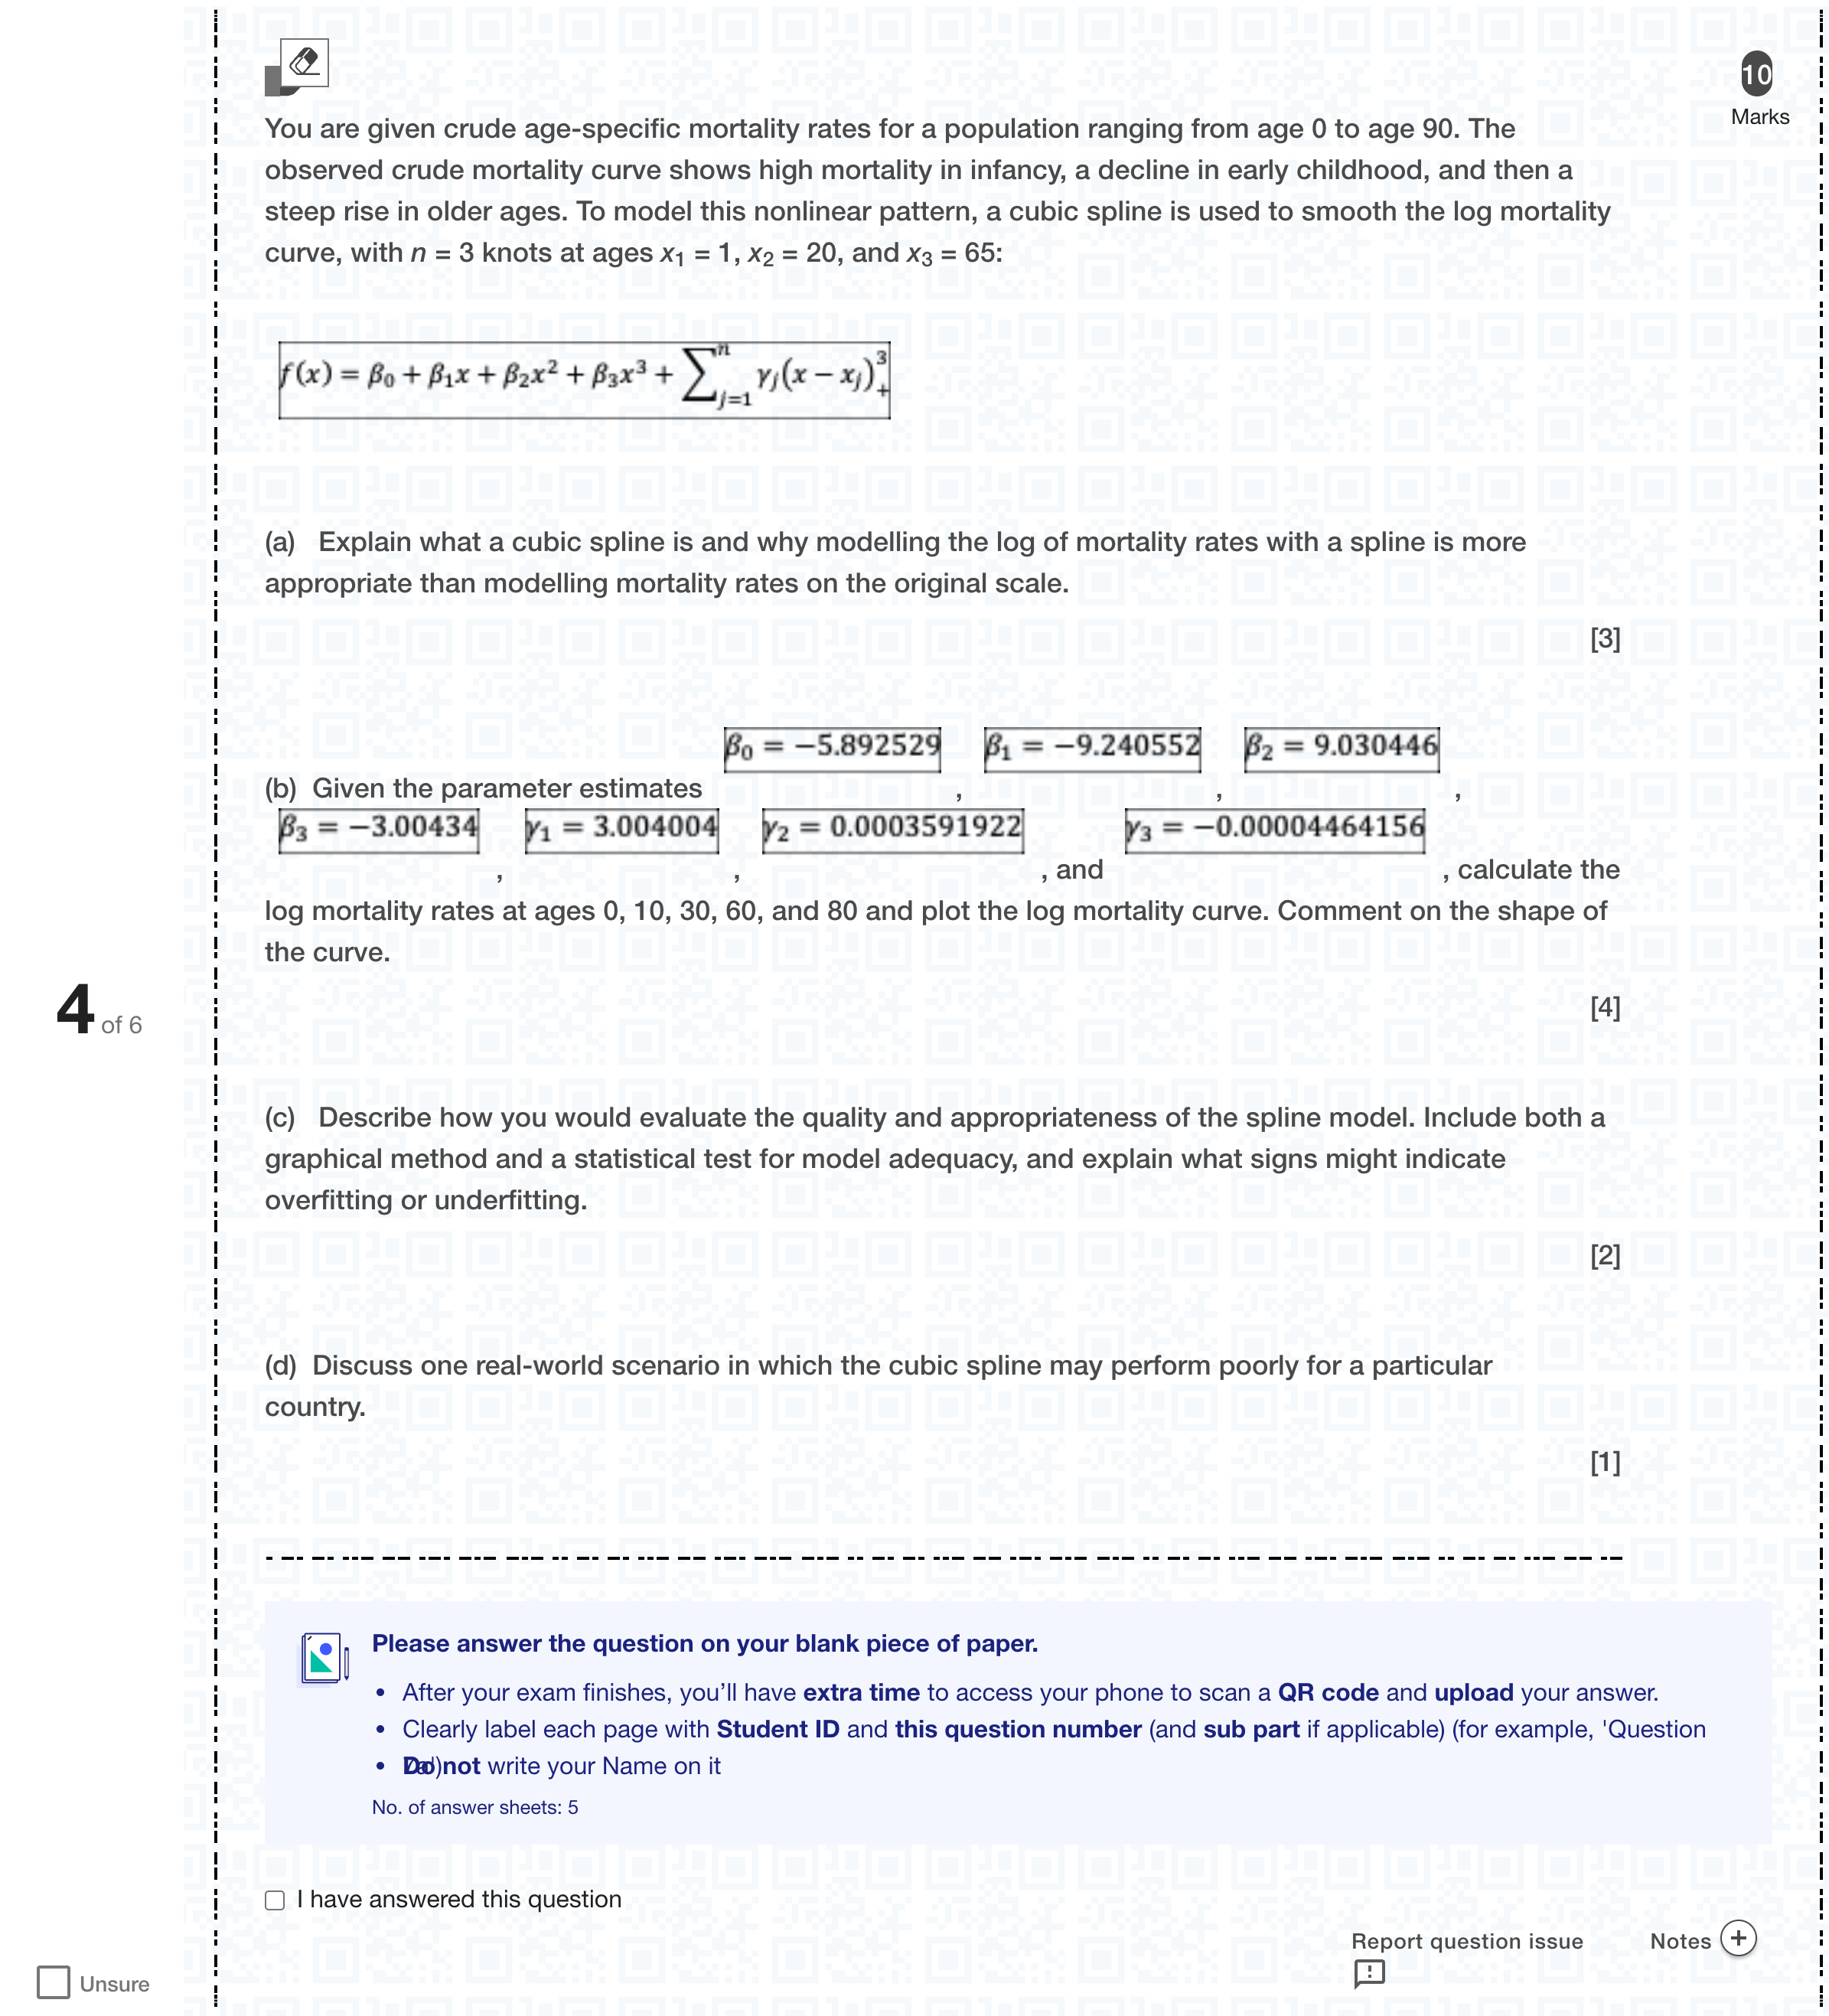
You are given crude age-specific mortality rates for a population ranging from age 0 to age 90. The observed crude mortality curve shows high mortality in infancy, a decline in early childhood, and then a steep rise in older ages. To model this nonlinear pattern, a cubic spline is used to smooth the log mortality curve, with n = 3 knots at ages x1 = 1, x2 = 20, and x3 = 65: (a) Explain what a cubic spline is and why modelling the log of mortality rates with a spline is more appropriate than modelling mortality rates on the original scale. [3] (b) Given the parameter estimates , , , , , , and , calculate the log mortality rates at ages 0, 10, 30, 60, and 80 and plot the log mortality curve. Comment on the shape of the curve.[4] (c) Describe how you would evaluate the quality and appropriateness of the spline model. Include both a graphical method and a statistical test for model adequacy, and explain what signs might indicate overfitting or underfitting. [2] (d) Discuss one real-world scenario in which the cubic spline may perform poorly for a particular country. [1][Fill in the blank]Multiple fill-in-the-blank
Log in for full answers
We've collected over 50,000 authentic original questions and detailed explanations from around the globe. Log in now and get instant access to the answers!
Similar Questions
One explanation for the U-shaped average variable cost curve is that greater Blank ______ yields more efficiency and variable cost per unit of output declines
An increase in the price of labor has no effect on which cost curve?
A firm's insurance premiums are generally considered costs.
A researcher is analysing the time until job loss for a sample of workers. The following Cox proportional hazards model has been estimated: where • Training = 1 if participated in job training, 0 otherwise • Age = age of worker • Union = 1 if union member, 0 otherwise (a) Explain the structure of this Cox proportional hazards model. What does the baseline hazard represent, and what does the proportional hazards assumption imply? [2] (b) Describe the partial likelihood estimation method for estimating the coefficients here. [4] (c) Calculate the hazard ratio for the following two individuals and interpret the result. Individual A: Age = 40, Training = 1, Union = 0 Individual B: Age = 40, Training = 0, Union = 0 [4][Fill in the blank]
More Practical Tools for Students Powered by AI Study Helper
Making Your Study Simpler
Join us and instantly unlock extensive past papers & exclusive solutions to get a head start on your studies!