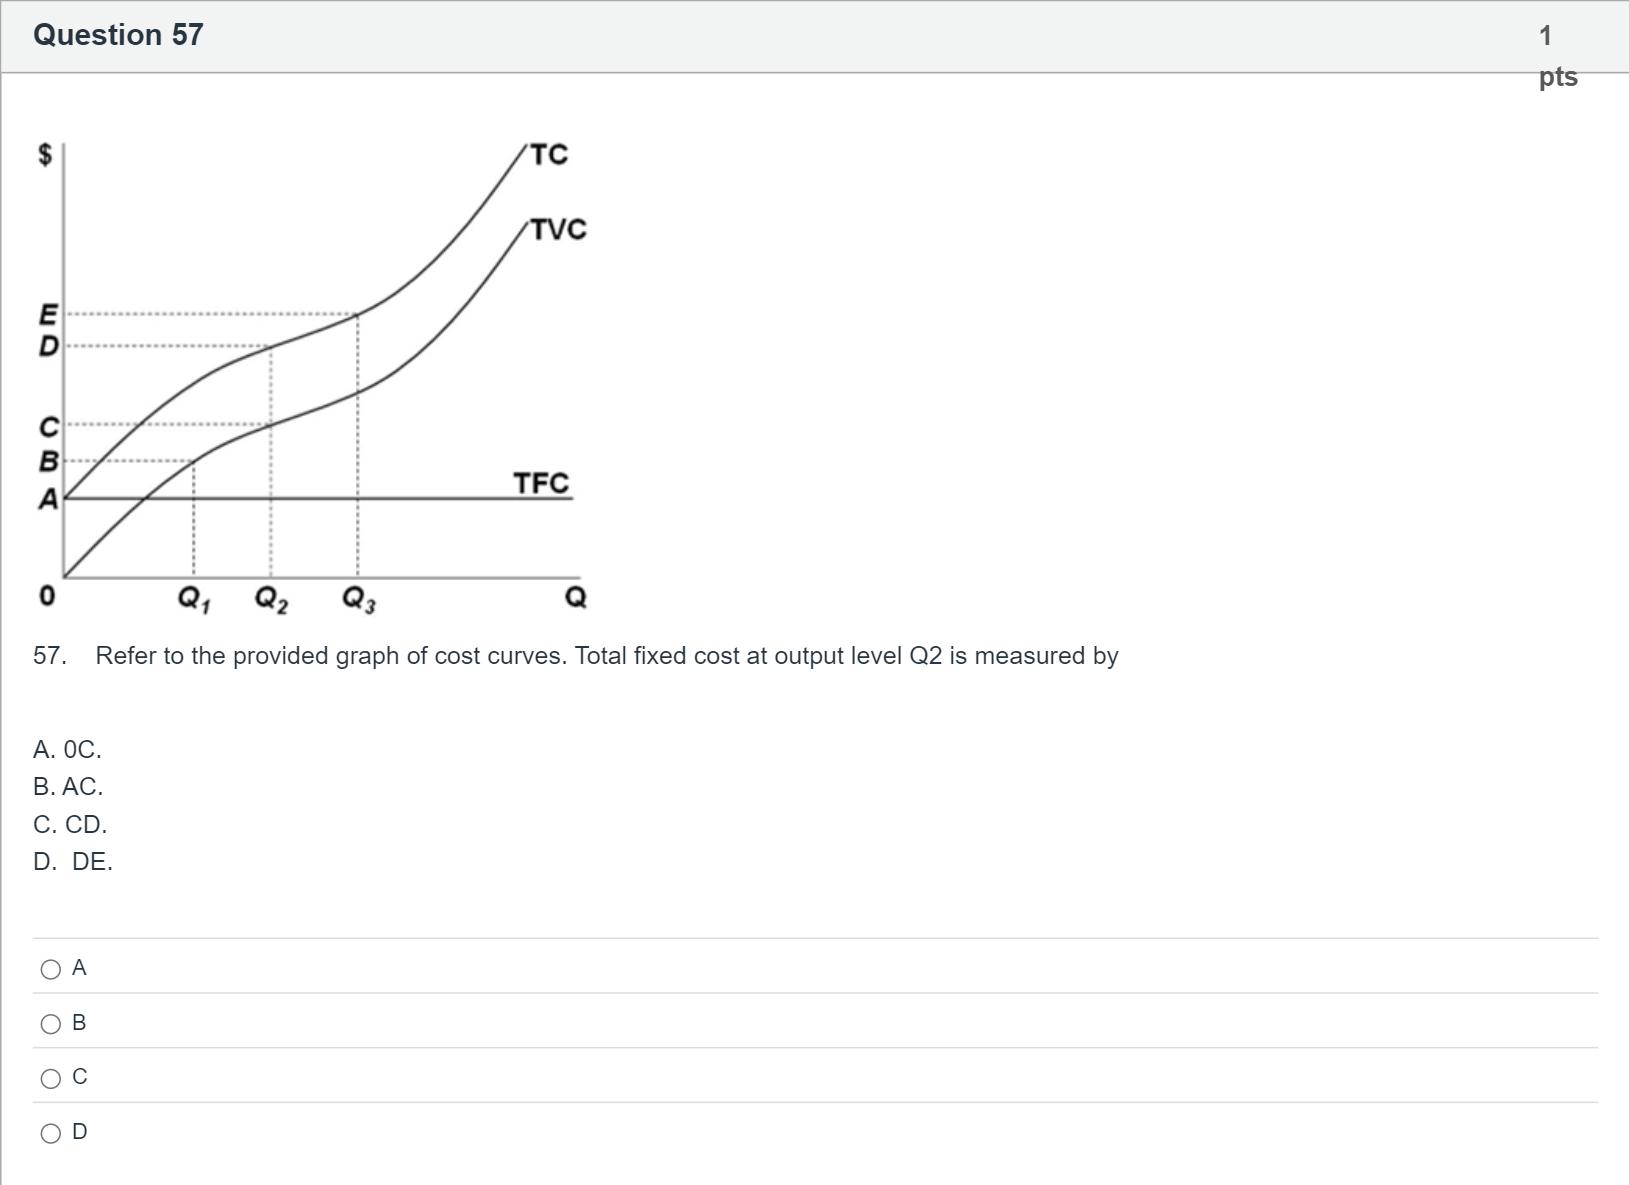
57. Refer to the provided graph of cost curves. Total fixed cost at output level Q2 is measured by A. 0C. B. AC. C. CD. D. DE.Single choice
A
A
B
B
C
C
D
D
Log in for full answers
We've collected over 50,000 authentic original questions and detailed explanations from around the globe. Log in now and get instant access to the answers!
Similar Questions
An increase in the price of labor has no effect on which cost curve?
Question 7.54 Choose the correct answerSuppose that the marginal cost of producing a pound of cereal is $2, irrespective of the level of output, but there are also some fixed costs of production. Read the following statements and select the correct one.
71.. Because of higher gasoline prices, firms using gasoline intensively in the production or distribution of their goods have experienced A. an upward shift in their MC, AVC, and ATC curves. B. an upward shift in their AFC, AVC, and ATC curves. C. a downward shift in their MC, AFC, and AVC curves. D. greater economies of scale. a competitive industry will produce that level of output where average total cost is at a minimum.
44. The provided graph gives short-run data for a firm. Which of the following statements is correct? A. Production is profitable only when price is above P3. B. Average fixed cost is (P3 - P1) at output Q4. C. The firm will produce an output of Q1 when price is P1. D. At price P1, the firm will not supply any quantity.
More Practical Tools for Students Powered by AI Study Helper
Making Your Study Simpler
Join us and instantly unlock extensive past papers & exclusive solutions to get a head start on your studies!